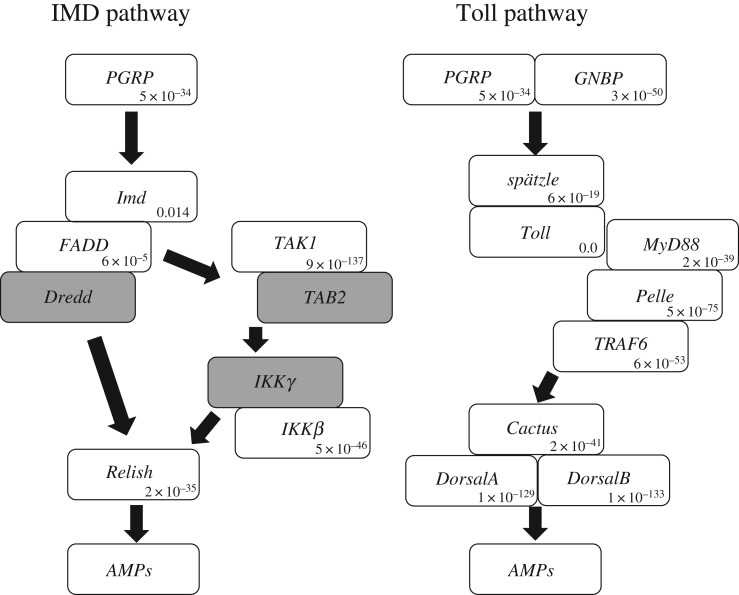
Figure 2.
Genes cascades of IMD and Toll pathways. White and grey boxes show presence and presumable absence of the genes in P. stali, respectively. The number in each white box is blastp e-value of the orthologue in P. stali using the amino acid sequence of D. melanogaster as a query. For PGRP and GNBP family members, those with lowest e-value are shown (For PGRP, PsPGRP-L1b and DmPGRP-LE exhibit lowest e-value (5 × 10⁻³⁴); for GNBP, PsGNBP1 and DmGNBP1 exhibit lowest e-value (3 × 10−50)).

