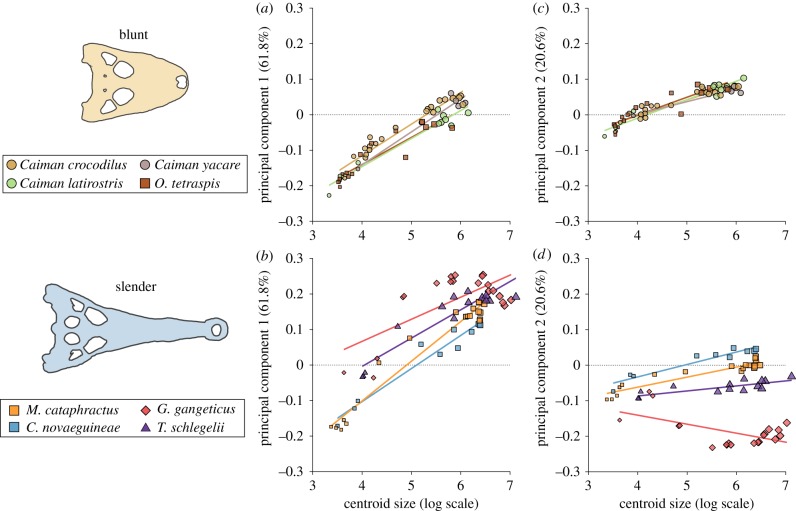
Figure 2.
Comparison of PC1 (a,b) and PC2 (c,d) ontogenetic trajectories for blunt and slender ecomorphs reveals more distinct ontogenies for slender forms while blunt species are nearly indistinguishable. For moderate ecomorph comparisons, see electronic supplementary material, figure S8. (Online version in colour.)

