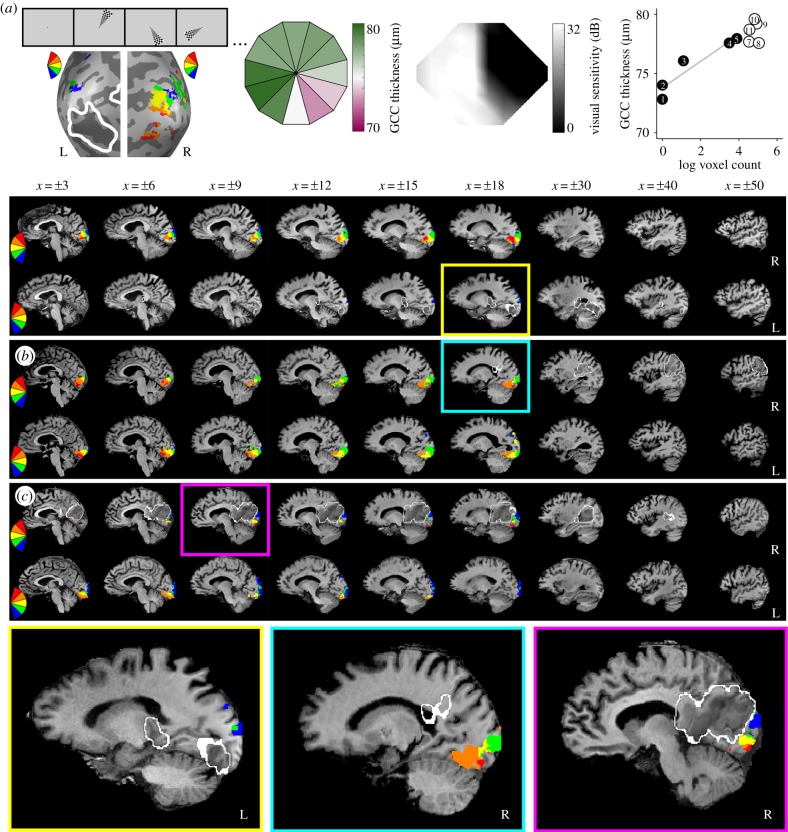
Figure 1.
Overview of key measures. (a) Example measures from participant 5 collected at the final time point. Winner map of fMRI activity to flickering checkerboard wedges (stimulus example shows random order, lesion outlined from clinical T2 FLAIR or diffusion-weighted image *DWI shown in white; left panel), GCC thickness averaged over both eyes (shown in retinal coordinates; left middle panel), visual field cut (black is blind) determined from automated 24–2 Humphrey perimetry collected as standard of care two days post-stroke (right middle panel) and a plot of the relation between GCC thickness and fMRI activity binned by initial blind (black circles, TD ≤ −6 dB) or sighted wedge locations (white circles, TD > −6 dB; right panel). In the plot, GCC thickness values are translated to visual field coordinates (flipped horizontally); numbers correspond to the wedge number by clock hour, grey line is for blind wedges only. Sagittal slices showing the lesion (outlined in white) and a winner map of visual cortex activity, masked by the medial occipital lobe, for representative patients of varying lesion volumes: (a) small (participant 5, final time point), (b) medium (participant 15, initial time point), and (c) large (participant 14, initial time point). See electronic supplementary material, figure S2 for all other participant activation maps.

