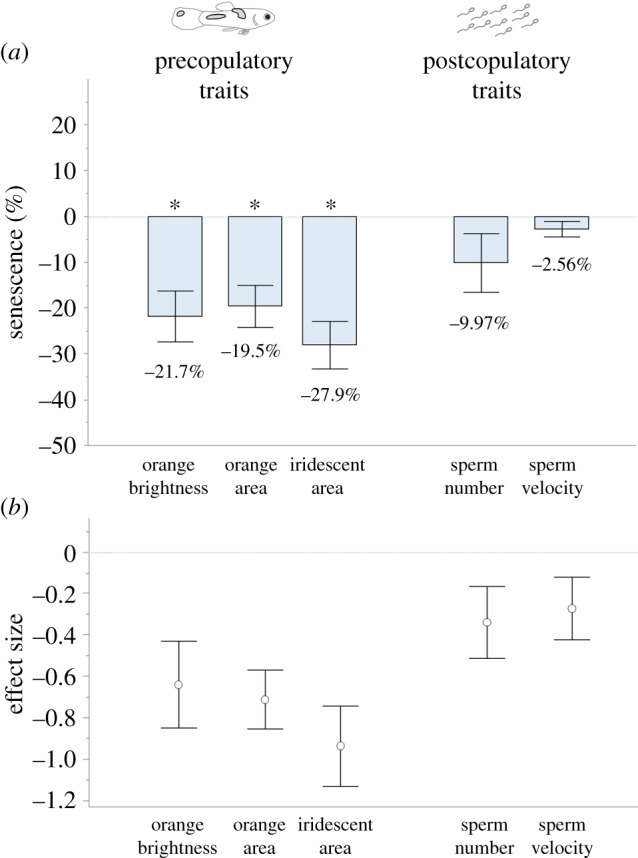
Figure 2.

(a) Relative decline of pre- and post-copulatory traits, expressed as percentages. Asterisks indicate that the change between an old and young age is significantly different from zero. The average senescence of pre-copulatory traits was on average four times larger than the senescence in post-copulatory traits (see text). Numbers indicate the mean values of the decline between the two male ages (young and old); bars represent ± s.e. (b) Decline of pre- and post-copulatory traits, expressed as effect size (Cohen's d). (Online version in colour.)
