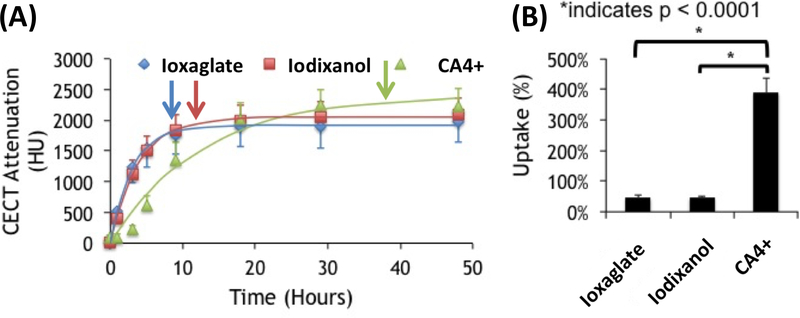
Figure 2.
Diffusion trajectories of cationic (CA4+), anionic (ioxaglate), and nonionic (iodixanol) contrast agents in bovine articular cartilage. (A) Average CECT attenuation values (reported in Hounsfield Units, HU) over the 48-hour time course of diffusion into the cartilage of bovine osteochondral plugs. Each point is reported as the average of six samples (mean ± standard deviation). Each contrast agent was fit to a nonlinear diffusion model (Equation 1). The arrow marks the time when 95% of the equilibrium attenuation is reached. (B) Equilibrium CECT attenuation (normalized by concentration) for each contrast agent in bovine osteochondral plugs (*p<0.0001).

