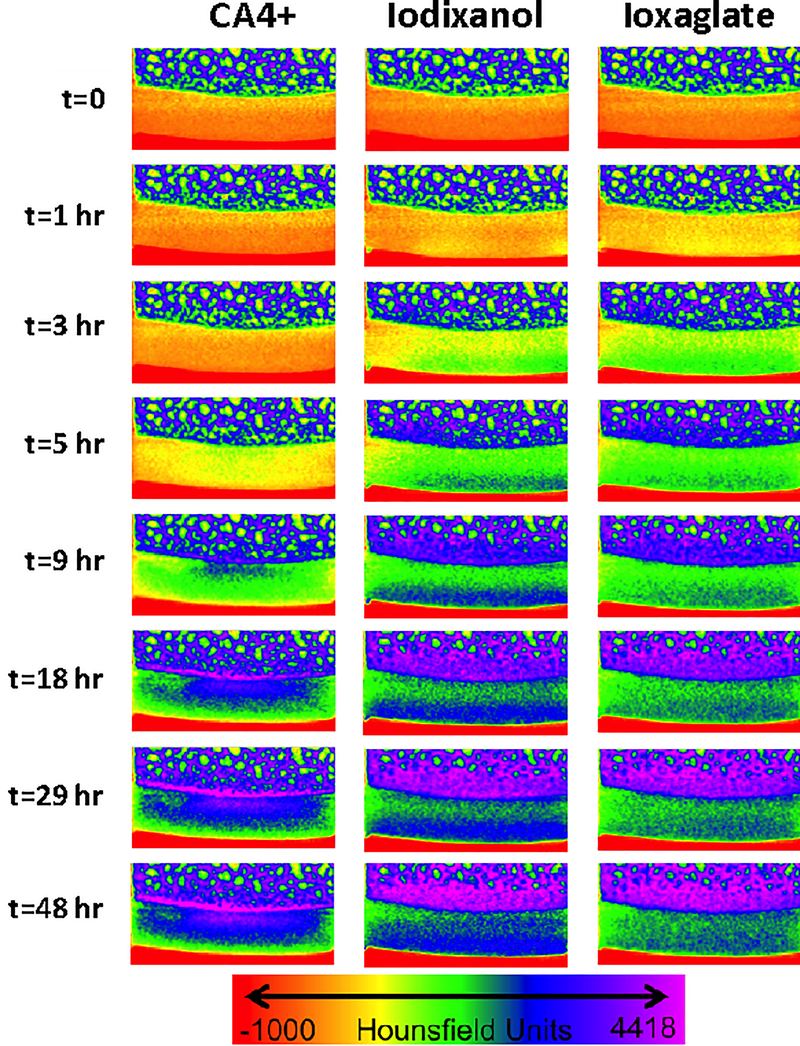
Figure 3.
μCT images of a bovine osteochondral plug visualized in color maps. All images are taken of the same plug cross section. The color map ranges from air in red (each image bottom), to cartilage in yellow, green and blue, & bone in dark blue and purple (each image top). The contrast agents diffuse into cartilage over time and the color turns from yellow to green to blue indicating higher CT attenuation.

