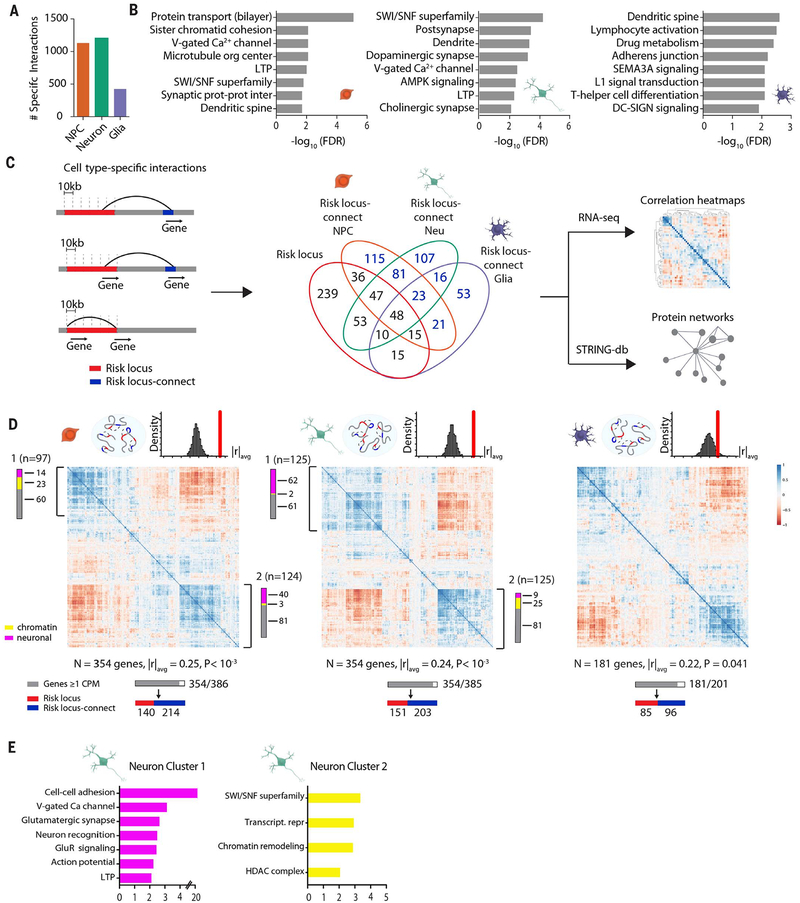
Fig. 3. Expanded GWAS risk connectome is associated with gene coregulation.
(A) Counts of highly cell type–specific contacts associated with schizophrenia risk in each of the three hiPSC-derived cell types. (B) GO enrichment of genes located in schizophrenia risk contacts in NPCs (left), neurons (middle), and glia (right). (C) (Left) Schematic workflow of analyses performed with cell type–specific contact genes, distinguished as “risk locus” and “risk locus–connect” genes. (Middle) Venn diagram of genes located in the 145 loci and those found in cell type–specific contacts, with numbers in blue indicating “risk locus–connect” genes. (Right) Schematic workflow of analyses performed with combined set of “risk locus” and “risk locus–connect” genes. (D) RNA Pearson transcriptomic correlation heatmaps consisting of risk locus and risk locus–connect genes derived from the cell type–specific contacts of NPCs (left), neurons (middle), and glia (right). Organization scores (|r|avg) for each heatmap are reported with P values from sampling analysis. Schematics above heatmaps are representations of each cell type’s particular connectome (blue oval) and frequency distribution of organization scores from permutation analyses of randomly generated heatmaps (red, observed organization score of heatmap being tested). The gray bar corresponds to n genes that have at least 1 count per million in RNA-seq dataset out of the total number of genes and are used to construct the heatmap; red and blue bars indicate how many of the genes in the heatmap are in a risk locus (red) and are risk locus–connect (blue). Fuchsia, neuron connectivity/synaptic function genes; yellow, chromatin remodeling genes as determined from gene ontology analysis in (E). Additional information on coexpression clusters is provided in tables S22 and S23 (figs. S8 and S9).

