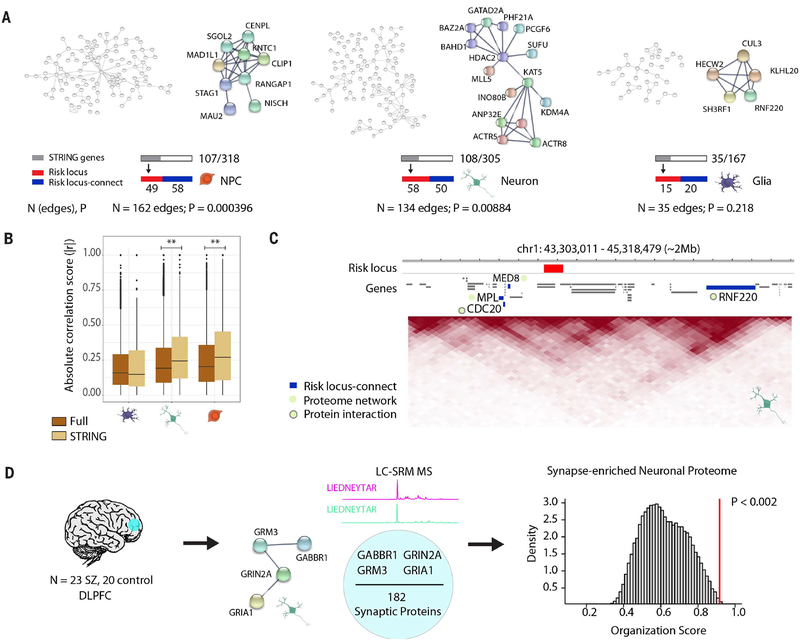
Fig. 4. Expanded GWAS risk connectome is linked to protein-protein association networks.
(A) Overview and representative examples (zoomed in) of protein-protein association networks in NPCs (left), neurons (middle), and glia (right). Numbers of edges connecting the proteins in each network and STRING-computed P values are reported below. Gray bar indicates the subset of these genes whose proteins are involved in the network out of the total number of genes from cell type–specific interactions; red and blue bars indicate how many of the genes in the network are in a risk locus (red) and are risk locus–connect (blue). (B) Comparison of organization scores between the full RNA transcriptomic correlation heatmaps (brown) (Fig. 3D) and the “STRING” heatmaps (tan) (figs. S13 to S15), consisting of only those genes in protein networks for each cell type. Permutation test, **P < 0.01. (C) Representative neuronal TAD landscape (chr1, ~2 Mb) depicting a schizophrenia risk–associated locus (red) with its risk locus–connect genes (blue), MED8, MPL, CDC20, and RNF220, which are members of the neuronal schizophrenia protein network (green circle). CDC20 and RNF220 interact at the protein level (green circle with gray border). (D) (Left) Liquid chromotography–selected reaction monitoring (LC-SRM) mass spectrometry (MS) was performed on dorsolateral prefrontal cortex (DLPFC) tissue from 43 adult postmortem brains (23 schizophrenia, 20 control). (Middle) 182 neuronal proteins were reliably quantified, and four of them were observed to have associations in the neuron protein network in (A). (Right) GABBR1, GRM3, GRIN2A, and GRIA1 proteins were found to have significantly more correlated expression than expected by random permutation analysis. Additional information on protein-protein interactions is provided in figs. S9 to S15.

