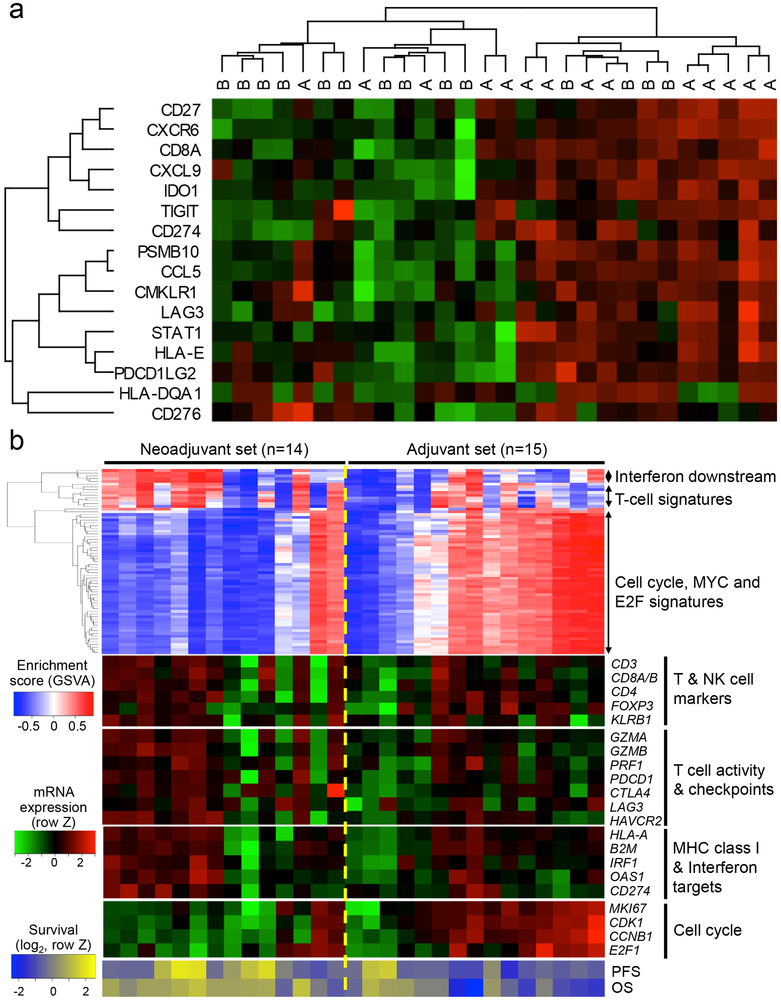
Figure 2. Tumor gene expression profile altered by neoadjuvant PD-1 blockade.
(a) Heat map of tumor mRNA expression of interferon-γ related gene panel for individual patients. Within this panel, “A” denotes patient in neoadjuvant group; “B” denotes patient in adjuvant-only group. Dendrograms represent unsupervised hierarchical clustering by Ward’s minimum distance. Green coloration represents decreased expression; red coloration represents increased expression. (b) (Top) Heatmap showing the gene set variation analysis (GSVA) enrichment scores of gene sets with interquartile range (IQR) ≥ 1. The gene sets can be grouped into the three categories: 1) interferon pathway induction, 2) T-cell activity and 3) cell cycle/proliferation. (Middle) The heatmap of mRNA expression of the representative genes corresponding to the gene set enrichments above. (Bottom) The heatmap of progression free- and overall survival of each patient (in log2 scale). MHC: major histocompatibility complex. OS: overall survival. PFS: progression-free survival.

