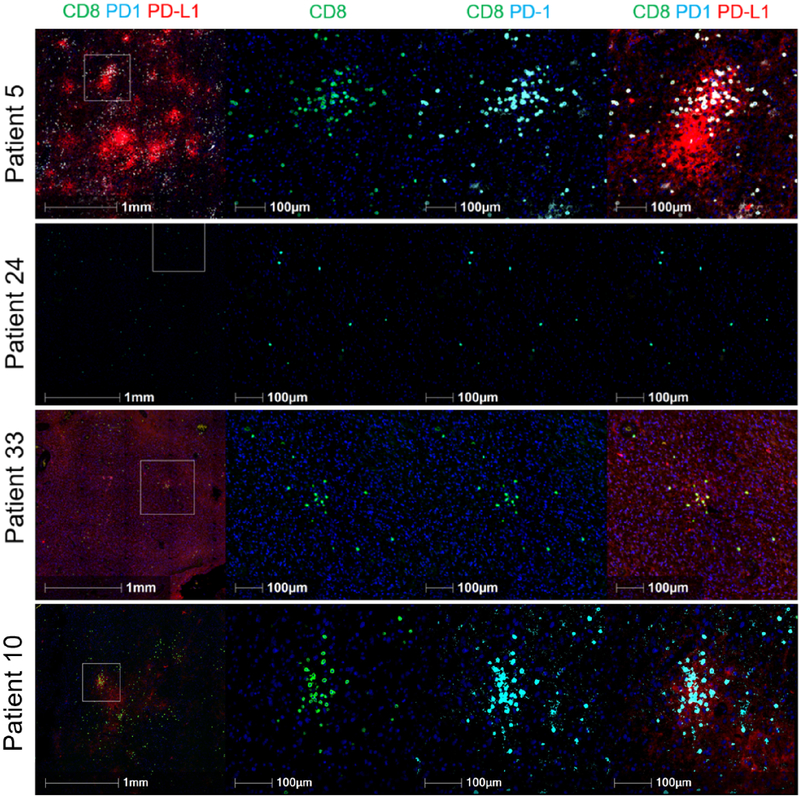
Figure 3. Multiplex immunofluorescence imaging of tumor samples demonstrates varying degrees of PD-L1 expression and CD8+ T cell infiltration.
In the top panel, high CD8 infiltrate and focal PD-L1 expression are demonstrated in a patient tumor sample from the neoadjuvant group. In the second panel, low CD8+ T cell infiltrate and negative PD-L1 expression are seen in a patient tumor sample from the adjuvant-only group. In the third panel, a patient tumor sample from the neoadjuvant group demonstrates low CD8 infiltration with constitutive PD-L1 expression. In the bottom panel, a tumor sample from a patient in the adjuvant-only group demonstrates high CD8 infiltration with focal PD-L1 expression; however, the degree of PD-L1 expression is lower. Images on the left are depicted at lower magnification to demonstrate the difference between focal and constitutive PD-L1 expression and are representative of the entire tumor section/slide. Images second from the left show staining for CD8; second from the right, PD-1 stains are superimposed; on the right, the images depict co-staining for CD8, PD-1 and PD-L1. Multiplex staining was performed in one standardized run per patient. For each staining run, two sequential slides were used as duplicates for each patient. Computational analysis was performed two or more times per sample.

