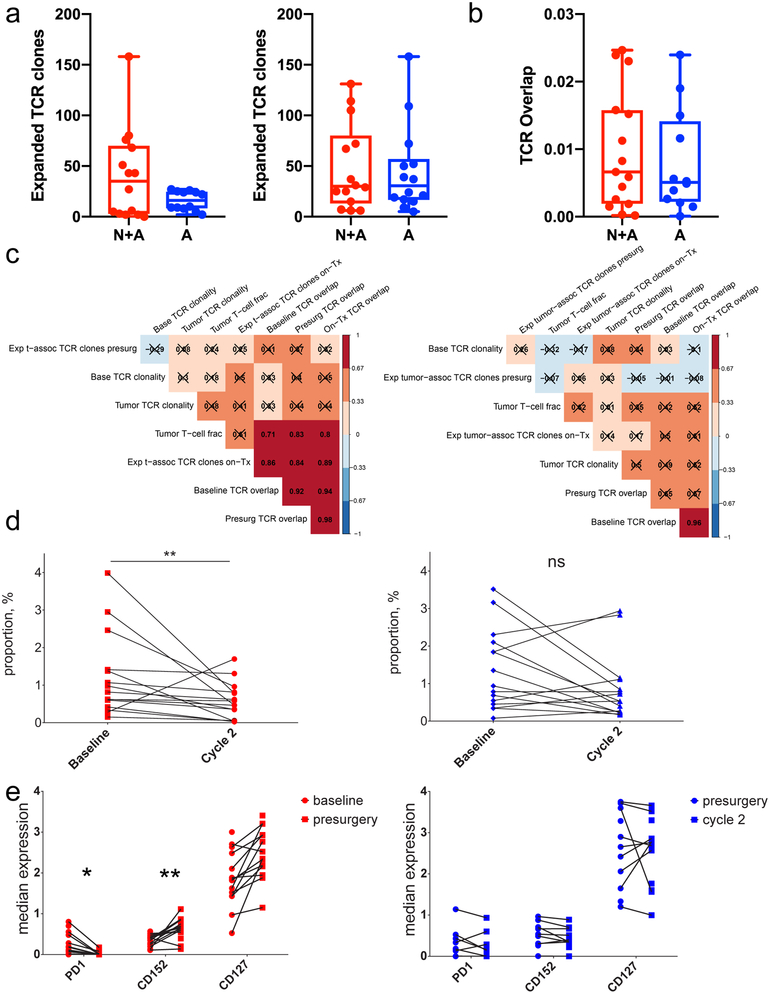
Figure 4. Neoadjuvant PD-1 blockade alters correlative relationships between blood and tumor repertoire features and alters circulating immune cell phenotypes.
(a) Box and whisker plots comparing the number of expanded T cell receptor clones between baseline and surgery (left; P = 0.07, two-tailed t test, t = 1.98, df = 14.33, 95% CI −1.94 to 50.7, n = 26 patients) and surgery and 1-2 cycles of pembrolizumab (right; P = 0.85, two-tailed t test, t = 0.19, df = 26.0, 95% CI −30.2 to 36.3, n = 28 patients). The Y axis denotes the number of expanded clones. (b) Box and whisker plot comparing the T cell receptor overlap between peripheral blood and tumor at the time of surgery (P = 0.59, two-tailed t test, t = 0.54, df = 24.8, 95% CI −0.01 to 0.008, n = 27 patients). On the Y axis, 0 indicates no clonal overlap and 1 indicates complete overlap. For panels (a) and (b), whiskers represent minima and maxima, boxes extend from 25th to 75th percentiles, middle line represents median. (c) Hierarchically ordered Spearman correlation plots of the T cell receptor sequencing data. Numbers indicate the Spearman correlation coefficient; boxes marked with an X had Benjamini-Hochberg adjusted, two-tailed P > 0.01 by asymptotic t approximation, n = 25 patients. Patients who received neoadjuvant PD-1 blockade (left) demonstrated significant relationships between multiple variables. (d) Scatter plot of the proportions of a peripheral cluster of intermediate monocytes (CD11b+CD11c+CD14+CD16+HLA-DRhi) at baseline and after 1-2 cycles of adjuvant therapy. The Y axis indicates percent of live mononuclear cells. n = 28 patients; Benjamini-Hochberg-corrected, two-sided P = 0.007 by general linear hypothesis test. (e) Scatter plot of selected cell surface markers on CD4+ T-cells before and after the first dose of pembrolizumab. Note the decreased PD-1 expression and increased CD152 (Benjamini-Hochberg corrected, two-sided P = 0.025 and 0.0015, respectively, general linear hypothesis test, n = 28 patients) in the neoadjuvant group (left). *: P < 0.05; **: P < 0.01; ns: non-significant; N+A: neoadjvant + adjuvant; A: adjuvant only.

