
Figure 2.
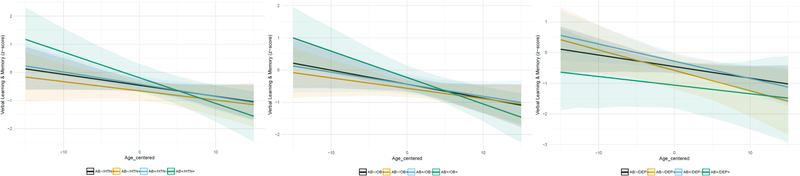
Graphs depict Verbal Learning & Memory z-scores on the y-axis, age at each visit (centered on mean age) on the x-axis, and estimated slopes for four beta-amyloid(Aβ)/risk factor groups adjusted for covariates of age at biomarker visit, sex, education, and practice effects. Risk factor groups are determined based on status at study visit closest to biomarker assessment. The left figure depicts the estimated slope for non-elevated Aβ and non-hypertensive (black; n=118), non-elevated Aβ and hypertensive (orange; n=27), elevated Aβ and non-hypertensive (blue; n=49), and elevated Aβ and hypertensive (green; n=13). The middle figure depicts the estimated slope for non-elevated Aβ and non-obese (black; n=78), non-elevated Aβ and obese (orange; n=67), elevated Aβ and non-obese (blue; n=40), and elevated Aβ and obese (green; n=22). The right figure depicts the estimated slope for non-elevated Aβ and non-depressed (black; n=136), non-elevated Aβ and depressed (orange; n=9), elevated Aβ and non-depressed (blue; n=58), and elevated Aβ and depressed (green; n=4).