
Figure 2.
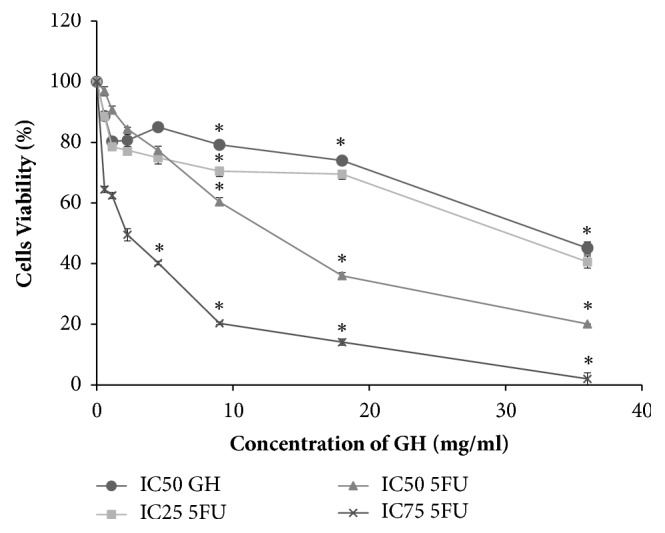
Effects of GH at CD50 concentration on the viability of HT-29 cells after incubation in different concentrations of 5-FU for 72 h. Each point represents the mean of the results of three independent experiments. Error bars represent means ± S.E.M. of the three independent experiments. ∗Statistical significance (P<0.05) between control cells and treatment groups.