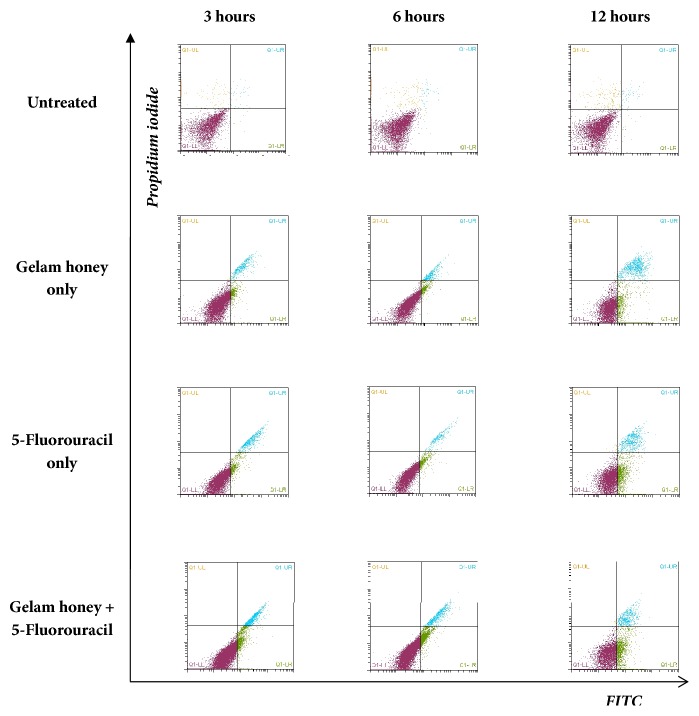
Figure 7.
Flow cytometry analysis of untreated and CD50-treated HT-29 cells via staining with Annexin V FITC/propidium iodide (PI). Viable cells are in the lower left quadrant, early apoptotic cells are in the lower right quadrant, late apoptotic cells are in the upper right quadrant, and nonviable necrotic cells are in the upper left quadrant. Each dot in the plot represents 10,000 cells in a single replicate.

