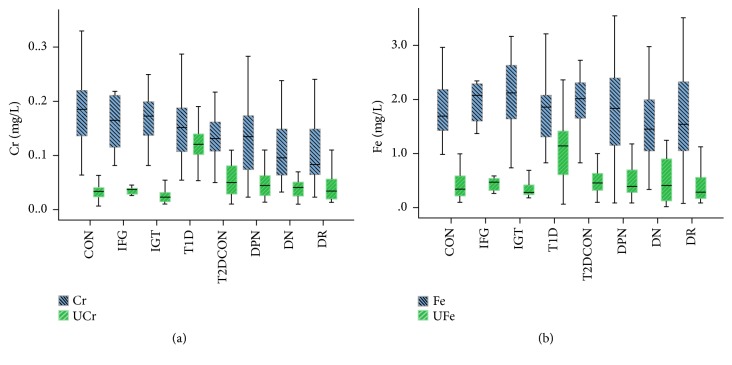
Figure 1.
Levels of Cr and Fe in the healthy control, IFG, IGT, T1D, T2D without complications, DPN, DN, and DR groups. Boxplots display the extreme, the upper and lower quartiles, and the median of the maximum difference in the healthy control, IFG, IGT, T1D, T2D without complications, DPN, DN, and DR groups. The median for each dataset is indicated by the centerline, and the first and third quartiles are presented by the edges of the area, which is known as the interquartile range (IQR). (a) Serum Cr levels decreased in the T2DCON, DR, DPN, and DN group (P<0.05) and urinary Cr level in T1D was the highest; (b) urinary Fe level of T1D was significantly increased (P<0.05).

