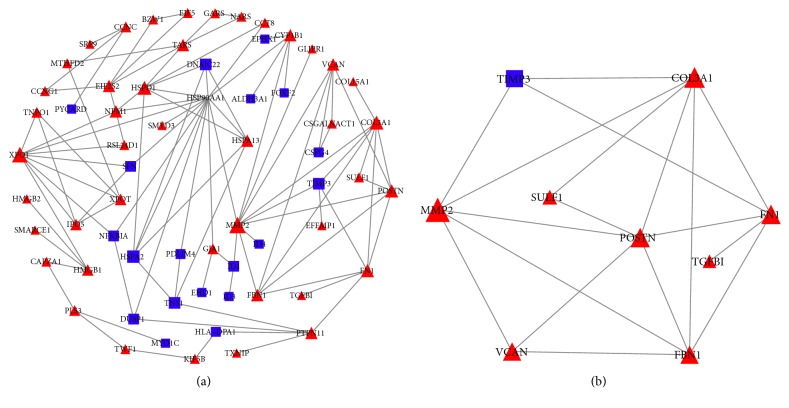
Figure 4.
(a) PPI Networks Analysis with Cytoscape for the 120 genes that are differentially expressed between nondegenerative disc AF cells and degenerative disc AF cells samples; (b) module networks of Module A. The red color and triangle in network indicate a gene that is upregulated in degenerative disc AF cells compared to the nondegenerative disc AF cells; blue color indicates the genes that are downregulated in degenerative disc AF cells compared to the nondegenerative disc AF cells samples.

