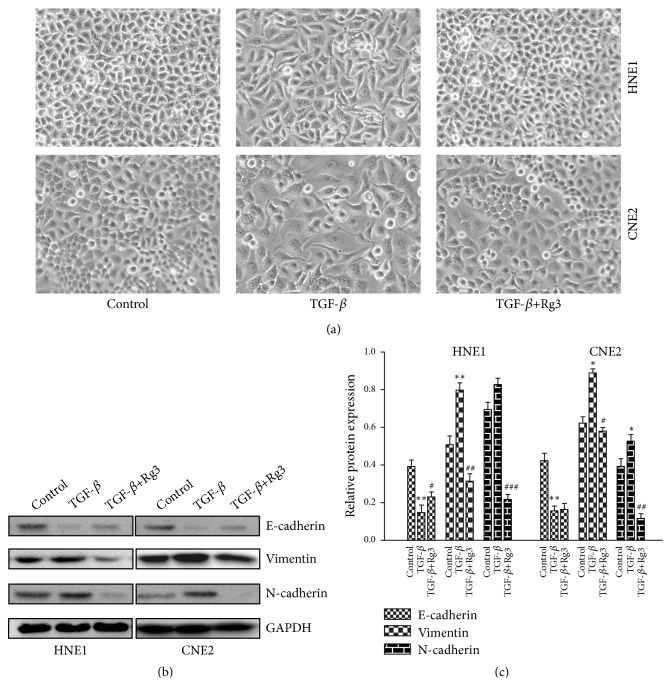
Figure 6.
Effect of Rg3 on TGF-β-induced EMT in HNE1 and CNE2 cells. (a) Morphological changes of EMT in HNE1 and CNE2 cells were detected by invert microscope. (b) Protein levels of E-cadherin, N-cadherin, and Vimentin were analysed by Western blot. (c) Relative protein expression of E-cadherin, N-cadherin, and Vimentin in HNE1 and CNE2 cells. Results are expressed as mean ± SD (n=3). ∗P<0.05 vs Control, ∗∗P<0.01 vs Control, #P<0.05 vs TGF-β, ##P<0.01 vs TGF-β, and ###P<0.001 vs TGF-β.

