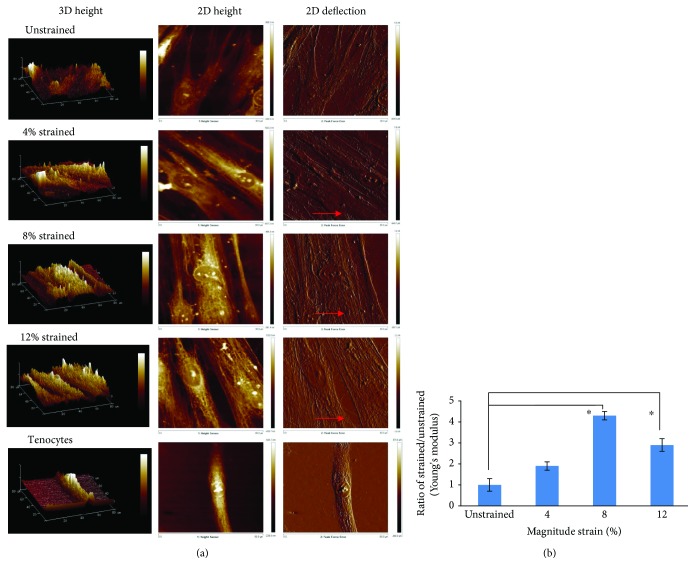
Figure 6.
The comparison of cell surface topography between the unstrained hMSCs, strained hMSCs, and tenocytes, visualized by AFM. (a) Representative AFM height and deflection scans of unstrained hMSCs and 4%, 8%, and 12% strained hMSCs, and tenocytes. In height images, brighter colour indicates higher distance of substrate. In deflection images, the detailed structure of presumably the stress fiber could be observed with AFM in different cell groups. The direction of uniaxial strain was in the red arrow direction. (b) Young's modulus on the cytoskeleton of the cells subjected to 4%, 8%, or 12% cyclic stretching for 72 h as indicated. The ratio was counted by normalizing to the expression amount of corresponding unstrained groups (indicated as 1). Statistical significance (p < 0.05) was represented by ∗ relative to the unstrained group. n = 3, error bar ± SD.

