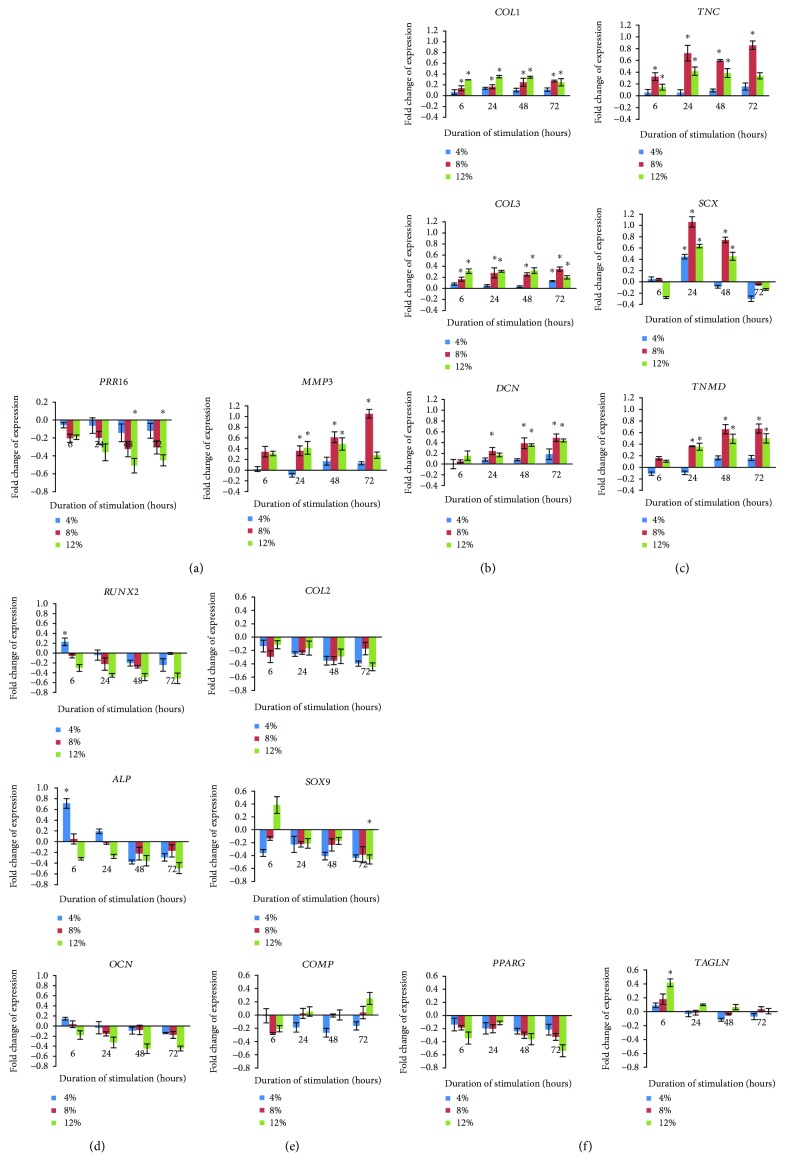
Figure 7.
mRNA expression level of different genes subjected to different strain for different time point. (a) mRNA expression of MMP3 and PRR16. (b) ECM component (COL1, COL3, and DCN). (c) Tendon cell lineage (TNC, SCX, and TNMD). (d) Bone cell lineage (RUNX2, ALP, and OCN). (e) Cartilage cell lineage (COL2, SOX9, and COMP). (f) Adipose cell (PPARG) and smooth muscle cell (TAGLN). The expression level of each gene was normalized with the level of housekeeping gene. The value of fold change was presented as the ratio of strained group with unstrained group. Statistical significance (p < 0.05) was represented by ∗ which compared to unstrained. N = 6, n = 3, error bar ± SD.

