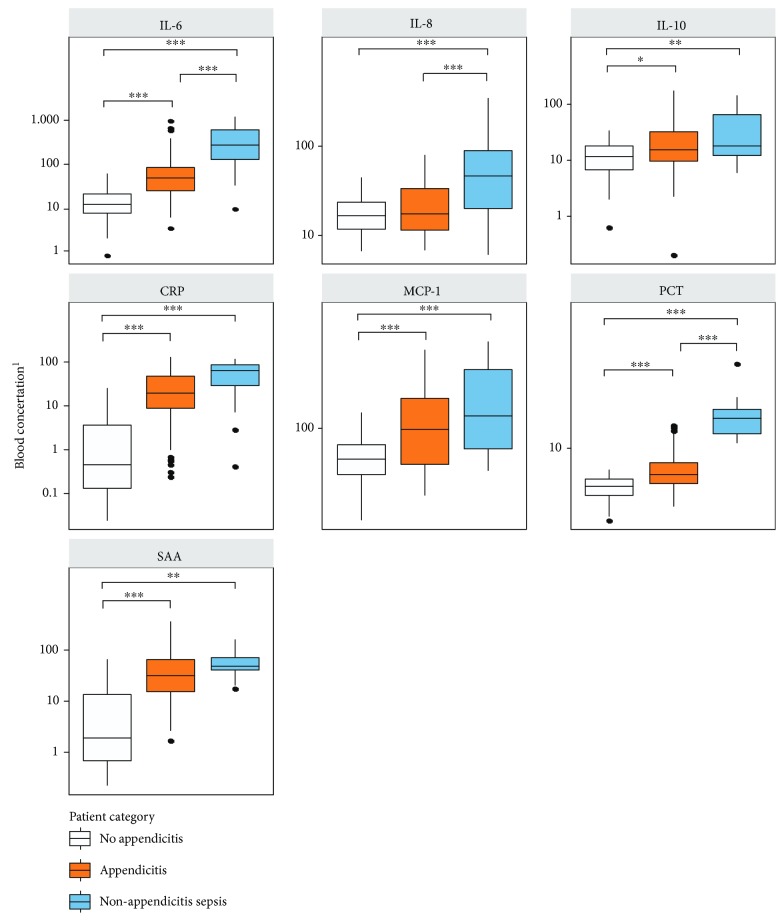
Figure 2.
Boxplots of 7 selected cytokine concentrations in pediatric patients (n = 196) grouped by category. Outliers (values >95th percentile) are not presented but were included in statistical comparisons using multivariate normal regression followed by least-square means post hoc pairwise contrasts using the Bonferroni correction [1]. Concentrations are in ng/mL for PCT, mg/L for CRP and SAA, and pg/mL for IL-6, IL-8, IL-10, and MCP-1, ∗ p value <0.05, ∗∗ p value <0.01, and ∗∗∗ p value <0.001.

