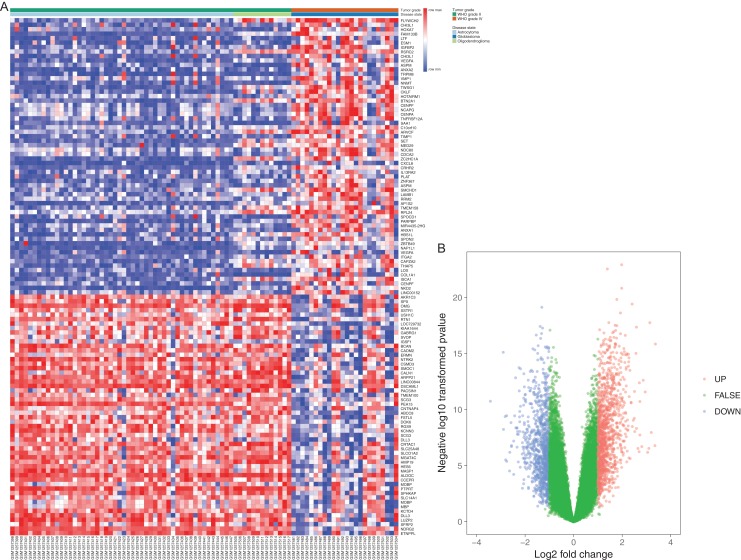
Figure 1. Differentially expressed gene expression heatmap and volcano plot of glioma.
(A) Differentially expressed gene expression heatmap of glioma (all upregulated and downregulated genes). (B) Differentially expressed genes were selected by volcano plot filtering (fold change ≥ 1 and P-value ≤ 0.05). The blue point in the plot represents the differentially expressed genes with statistical significance.

