
Figure 1.
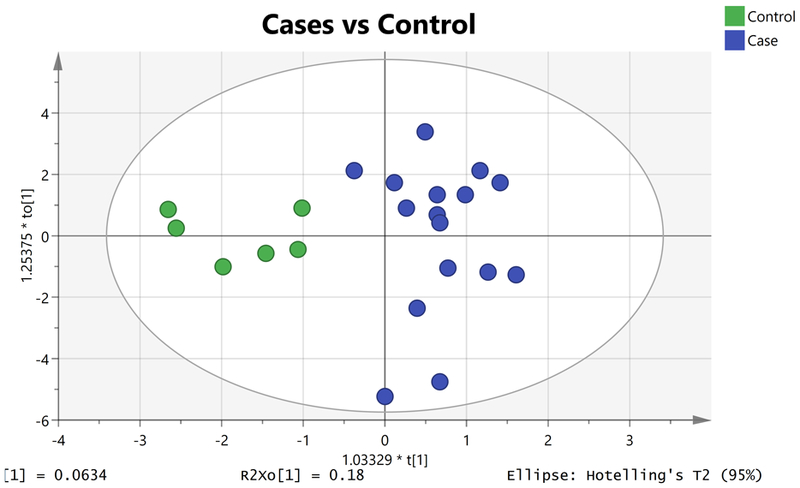
Orthogonal projections to latent structures discriminant analysis (OPLS-DA) Scores Plot showing separation of albuminuria (blue circles, right) from normal albuminuria (green circles, left) [R2X = 0.4; R2Y= 0.8; Q2=−0.1].
Official websites use .gov
A
.gov website belongs to an official
government organization in the United States.
Secure .gov websites use HTTPS
A lock (
) or https:// means you've safely
connected to the .gov website. Share sensitive
information only on official, secure websites.
Orthogonal projections to latent structures discriminant analysis (OPLS-DA) Scores Plot showing separation of albuminuria (blue circles, right) from normal albuminuria (green circles, left) [R2X = 0.4; R2Y= 0.8; Q2=−0.1].