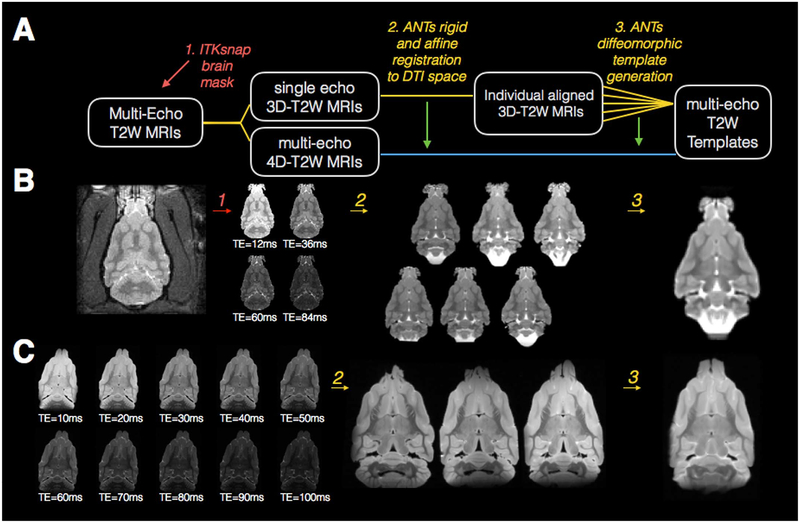
Fig. 2.
Processing pipeline and template generation for T2 images of the in-vivo and ex-vivo ferret brain. The diagram drawing (A) explains each step of processing that is performed for in-vivo and ex-vivo T2 template generation where rounded boxes describe the T2 image(s) at each step, numbered italicized text indicates the software and processing implemented for each step and the same-colored lines connect the input and output images for each step. Red and green arrows in (A) indicate the indirect use of data: the use of an ROI from brain segmentation to mask the 3D and 4D T2W images (red) and the application of the transforms derived from the 3D template generation to the 4D images (green). Representative in-vivo (B) and ex-vivo (C) images are shown for each processing step described in (A) including different contrast images labeled with corresponding TE values.

