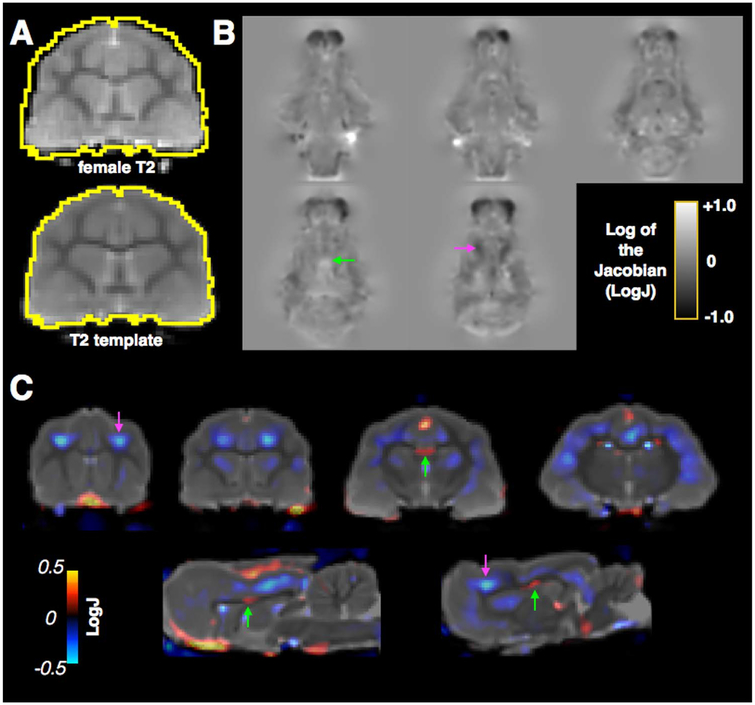
Fig. 8.
Demonstration of registration and LogJ analysis to identify sex differences in the ferret brain. A single female brain (A, top) was registered to the adult male template (A, bottom) to demonstrate voxelwise analysis morphologic differences. LogJ maps are shown at several levels (B) indicating local volume increases (positive values, green arrow) or decreases (negative values, magenta arrow) in the female brain compared with the template. An overlay map of LogJ is shown with respect to the T2 template (C) for visualization of brain regions with local expansion or contraction required to warp the female brain to the template where negative values (blue, magenta arrow) correspond to regions that are smaller in the female brain and positive values (red, green arrow) correspond to regions that are larger.

