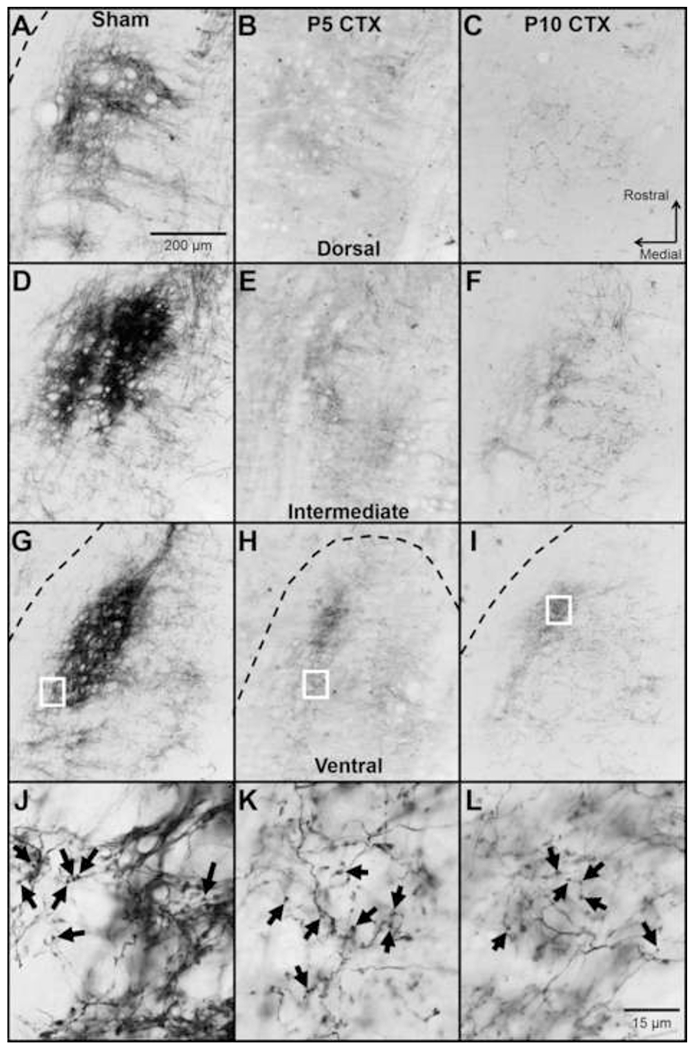
Figure 2.

Representative images of CT terminal field in the dorsal (A-C), intermediate (D-F), and ventral (G-I) NTS. Images are from an animal receiving Sham surgery at P10 (A, D, G, J), CTX at P5 (B, E, H, K), or CTX at P10 (C, F, I, L). The CT was labeled with BDA 50-51 days after surgery. The borders of the NTS are indicated with a dashed line in cases when the entire image is not within the NTS. In transected animals, spared CT fibers were observed in regions typically occupied by the control CT, even in the outer borders of the NTS. J-L shows a high magnification view of the CT terminal field in the ventral NTS. These images were taken from the areas outlined by white boxes in G-I. Examples of labeled boutons are shown with black arrows.
