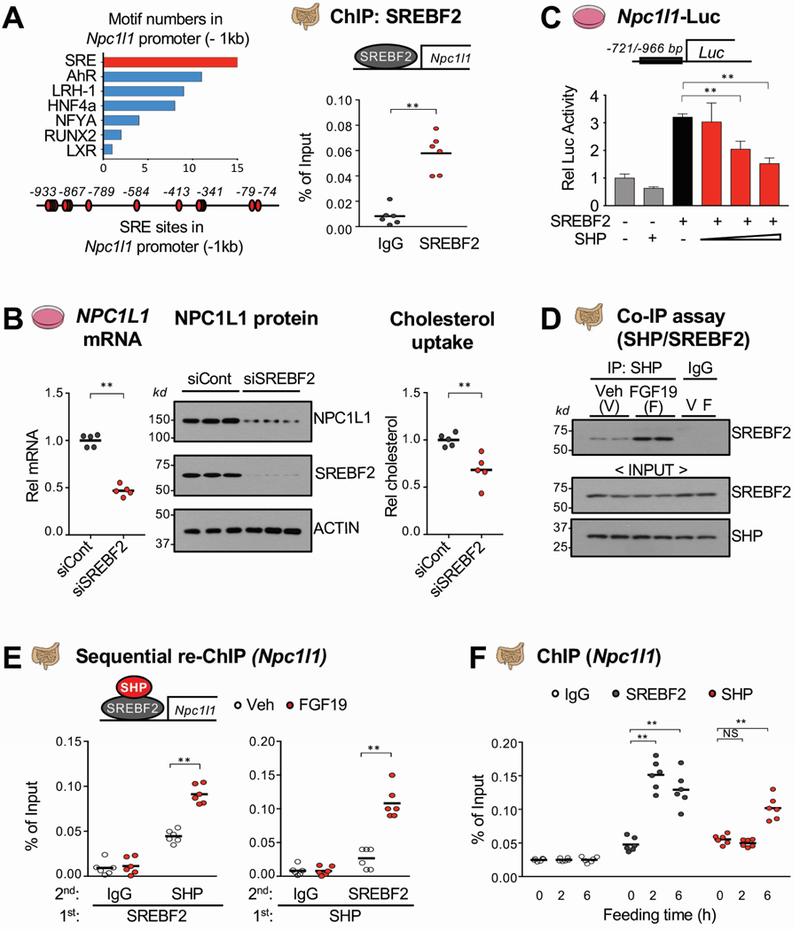
Figure 6. Inhibition of SREBF2-mediated transactivation of Npc1l1 expression by SHP.

(A) Motifs in about −1 kb of the Npc1l1 promoter (left) were identified using the JASPAR motif database and SREBF2 occupancy at the Npc1l1 promoter was determined by ChIP assay (right). (B) HT29 cells were transfected with siSREBF2 for 48 h and NPC1L1 mRNA (left) and protein (middle) levels were determined. NBD-cholesterol uptake (right) was determined as described in the legend to Figure 4E. (C) HT29 cells were transfected with plasmids as indicated for 48 h, then luciferase activity was measured and normalized to β-galactosidase activity. (D-E) WT mice were fasted overnight and injected with FGF19 (1 mg/kg) via tail vein, and 1 h later, the jejunum and ileum of intestine were removed for analysis. The interaction of SHP and SREBF2 was determined by Co-IP (D) and their co-occupancy at the Npc1l1 promoter was determined by sequential re-ChIP assay (E). (F) WT mice were fasted overnight and refed normal chow for 2 h or 6 h and SREBF2 and SHP occupancy using pooled jejunum and ileum samples were determined by ChIP assay. (A, B, C, E, F) Statistical significance was determined by (A, B) the Student’s t-test, (C) one-way ANOVA, or (E, F) two-way ANOVA with the FDR post-test, (SEM, n=6, *P <0.05, **P <0.01, NS, statistically not significant).
