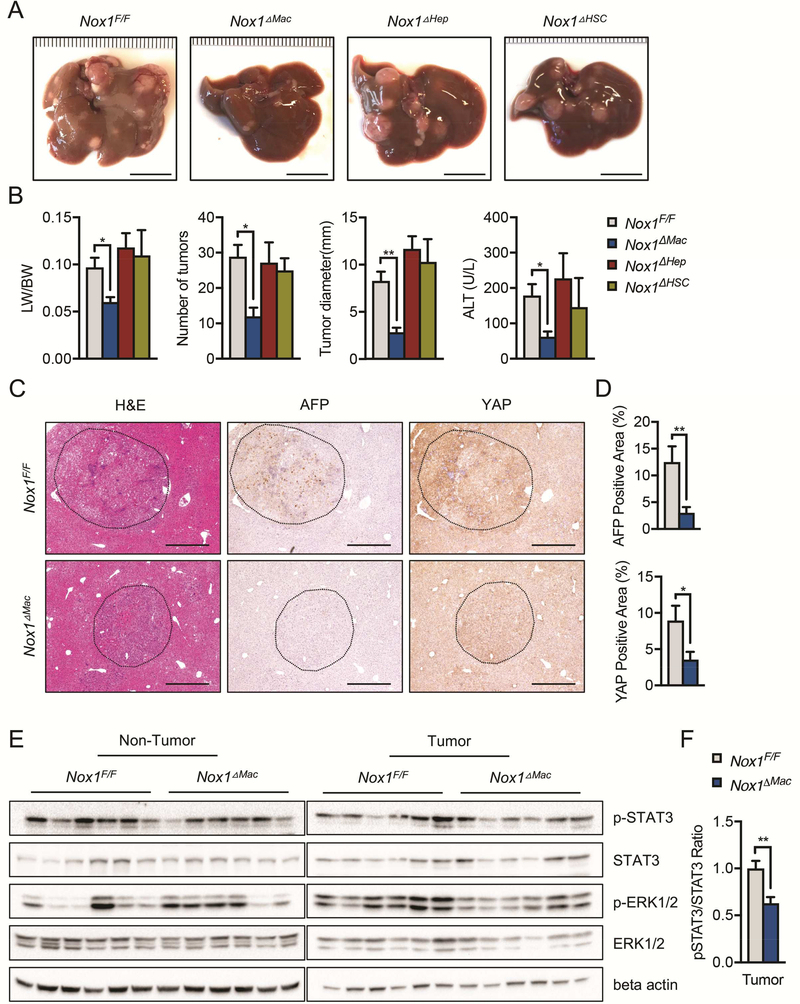
Figure 4. Macrophage NOX1 promotes HCC development.
(A) Representative livers from DEN-injected mice of indicated genotypes 9 month after birth (scale bar, 1 cm). (B) Liver weight/body weight (LW/BW) ratios, tumor numbers and maximum sizes of DEN-induced HCCs. Serum ALT amounts in indicated mice were measured by Infinity reagent (n≧6 mice/group). (C) Representative images of liver sections from DEN-injected mice that were stained with H&E, AFP and YAP. (D) Percentages of positive staining areas for AFP and YAP (scale bar, 200 mm) (n=6 mice/group). (E) IB analysis of p-STAT3, STAT3, p-ERK, and ERK in tumor and non-tumor liver tissues from DEN-injected mice. (F) Quantification of relative expression ratio of pSTAT3/STAT3 (n=6 mice/group). Data are shown as mean ± s.e.m.. Student’s t-test for independent samples and unequal variances was used to assess statistical significance (*P<0.05, **P<0.01, ***P<0.001).

