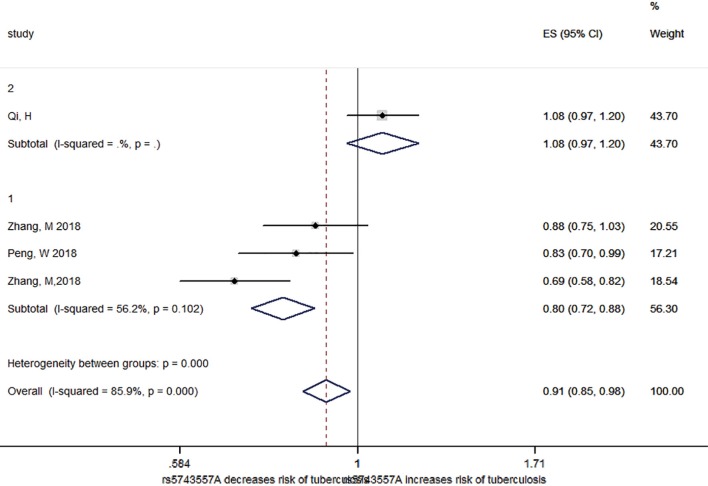
Figure 1.
Forest plot for the subgroup analysis of the association between rs5743557 and susceptibility to tuberculosis by age. 1 represents adults, 2 represents children. Each study cohort is represented by the name of the first author and publication year. The point estimate of the OR and 95% CI for each comparison are shown; the pooled OR and 95%CIs were derived from random-effects models. The I2 and P values are the heterogeneity test results. OR, odds ratio; CI, confidence interval.

