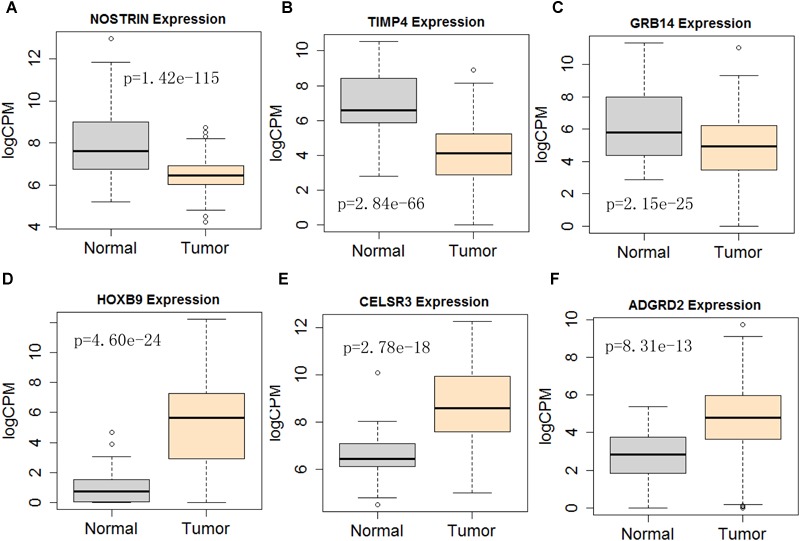
FIGURE 11.

Differential expression profile of the 6 mRNAs derived [NOSTRIN (A), TIMP4 (B), GRB14 (C), HOXB9 (D), CELSR3 (E), and ADGRD2 (F)] from COX analysis as compared to normal tissue. The number of normal control and tumor are 43 and 501, respectively.
