
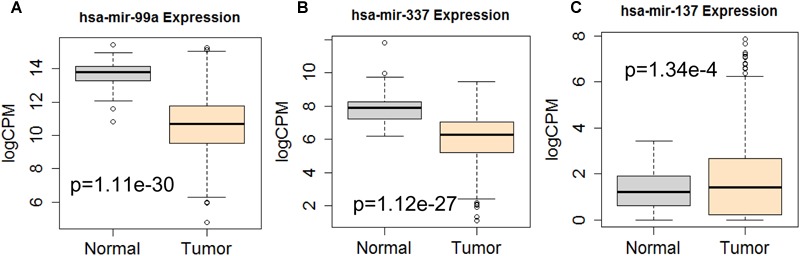
FIGURE 12.
Differential expression profile of the 3 miRNAs [hsa-mir-99a (A), hsa-mir-337 (B), and hsa-mir-137 (C)] derived from COX analysis as compared to normal tissue. The number of normal control and tumor are 44 and 522, respectively.
Official websites use .gov
A
.gov website belongs to an official
government organization in the United States.
Secure .gov websites use HTTPS
A lock (
) or https:// means you've safely
connected to the .gov website. Share sensitive
information only on official, secure websites.
Differential expression profile of the 3 miRNAs [hsa-mir-99a (A), hsa-mir-337 (B), and hsa-mir-137 (C)] derived from COX analysis as compared to normal tissue. The number of normal control and tumor are 44 and 522, respectively.