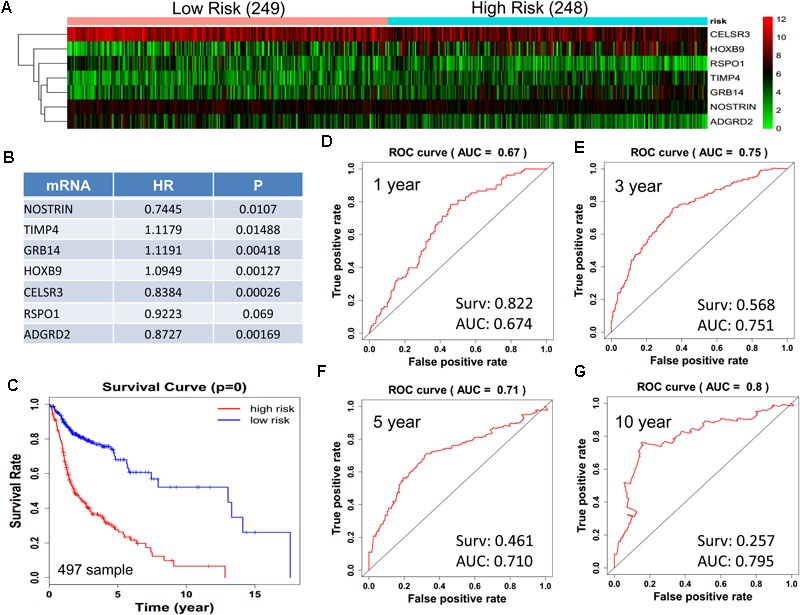
FIGURE 5.

Construction of survival risk score system based on multi-gene signature. Cox regression analysis for survival prediction by the 9-mRNA signature screened from 27 most significantly expressed mRNAs with p < 1E-3. (A) the expression heatmap of the 10 lncRNA in 497 tumor samples; (B) the HR and P-value in cox model; (C) the survival curve of patients with high risk and low risk; (D–G) the ROC curve in 1, 3, 5, 10 years with AUC value. Surv: survival rate.
