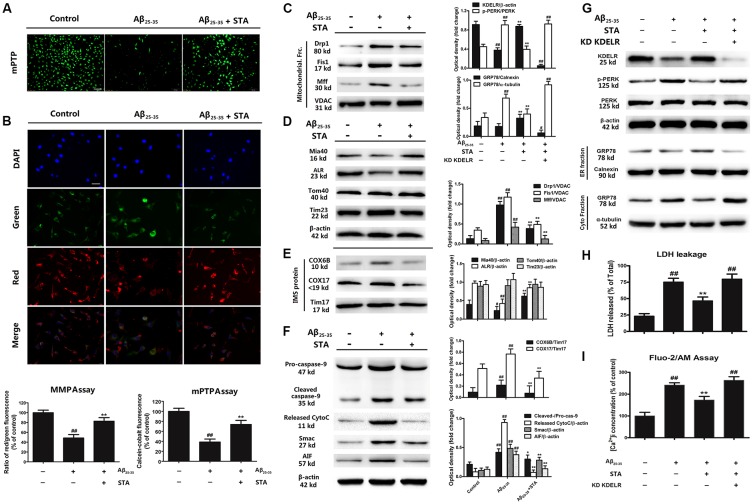
Figure 4.
STA inhibited the Aβ25–35-induced mitochondrial fission and apoptosis pathways, and the KDELR contributed to the cytoprotective effects of STA. (A) Effects of STA on the opening of the mitochondrial permeability transition pore (mPTP), as assessed using the calcein-cobalt quenching method. After treatment(s), cells were loaded with calcein dye and incubated with cobalt chloride, the emission wavelengths of which were 488 and 505 nm, respectively. The mPTP of cells in each group was calculated by examining the level of green fluorescence and analyzed using a fluorescence microplate reader. Scale bar: 100 μm. (B) The effects of STA on Aβ25–35-induced mitochondrial membrane potential (MMP) depolarization were visualized using the MMP-sensitive dye JC-1. Red fluorescence from JC-1 indicates healthy mitochondria with polarized inner mitochondrial membranes, while green fluorescence is emitted by cytosolic JC-1 monomers and indicates MMP dissipation. Merged images indicate the co-localization of JC-1 aggregates and monomers. The MMP was analyzed using a fluorescence microplate reader after JC-1 staining. Scale bar: 50 μm. The results are expressed as a percentage of the control. (C) Effects of STA on the levels of Drp1, Fis1, and Mff in the mitochondrial fraction. (D) Effects of STA on the levels of mitochondrial intermembrane space assembly protein 40 (Mia40), ALR, Tom40, and Tim23. (E) Effects of STA on the levels of cleaved caspase-9, released cytochrome C, Smac, and AIF. (F) KDELR knockdown abolished the STA-alleviated ER stress and apoptosis. (G) KDELR knockdown abrogated the STA-reversed retention of ER chaperones and ER stress. (H) KDELR knockdown attenuated the anti-apoptotic effects of STA. (I) KDELR knockdown reversed the effects of STA on [Ca2+]i. Densitometric analyses of protein bands were normalized to a loading control. Cells were pre-incubated for 4 h with STA and then co-treated with Aβ 25–35 for 8 h (24 h in H). The untreated control group was incubated with the appropriate amount of vehicle. The results are expressed as the mean ± the standard deviation of three independent experiments. #P < 0.05 vs. the control, ##P < 0.01 vs. the control, *P < 0.05 vs. Aβ25–35 treatment, **P < 0.01 vs. Aβ25–35 treatment.

