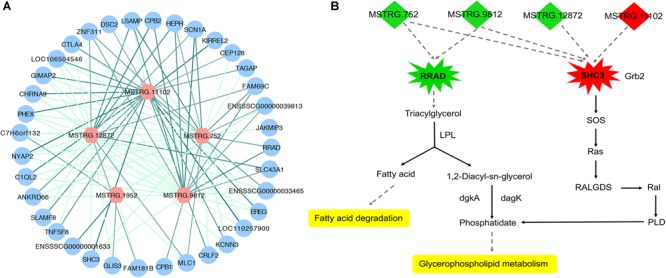
FIGURE 6.

Expression regulation analysis of DEL genes and their DEPTGs. (A) Co-expression network of DELs and DEPTGs.DELs are indicated in red hexagons;DEPTGs are indicated in blue circles; light green edge represent DELs downregulate DEPTGs; dark green edge represent DELs upregulate DEPTGs. (B) Potential pathways for DELs and DEPTGs. red indicates that the genes are upregulated in fat pigs, green indicates downregulation in fat pigs, and yellow indicates potential pathways for DELs and DEPTGs; quadrilaterals represent DELs, irregular polygons represent DEPTGs, and dash lines indicate predict interactions.
