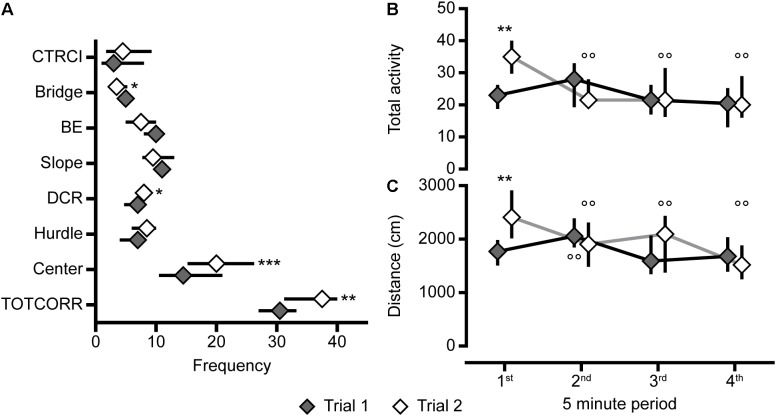
FIGURE 10.
Repeated testing, number of visits to the zones, and activity over time in the MCSF. (A) Frequency of visits to the zones in the whole 20-min trials, and (B) total activity and (C) distance traveled in the four 5-min periods of the MCSF test in trials 1 and 2 of the animals repeatedly tested in the MCSF (n = 12). Data are presented as median with upper and lower quartiles. ∗p < 0.05, ∗∗p < 0.01, ∗∗∗p < 0.001 relative to trial 1 (Wilcoxon matched pairs test); ∘∘p < 0.01, compared to the first 5 min in the respective trial (post hoc Wilcoxon matched pairs test). BE, bridge entrance; CTRCI, central circle; DCR, dark corner room; TOTCORR, total corridor.

