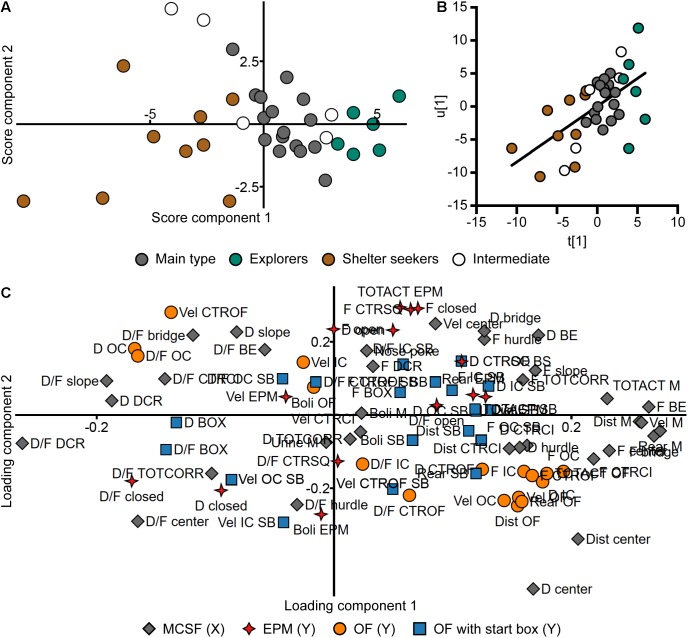
FIGURE 11.
Relationship between the MCSF and the other exploratory tests. Scatter plots of (A) individual scores and (C) variable loadings from the PLS analysis (n = 36, four components, R2X = 0.639, R2Y = 0.520, Q2 = –0.087) of the parameters from the MCSF (X) and EPM, OF, and OF with start box (Y). Score plot colored according to behavioral type, loading plot according to test. An enlarged version of (C) is available in Supplementary Figure 3. (B) Correlation between the latent variables t[1] and u[1]. The t/u score reveals a positive correlation (p < 0.001, r = 0.57, Spearman rank order correlation). BE, bridge entrance; CTRCI, central circle; CTROF, center open field; CTRSQ, central square; D, duration; DCR, dark corner room; Dist, distance; EPM; elevated plus maze; F, frequency; IC, inner circle; M, MCSF; OC, outer circle; OF, open field; SB, start box (test); TOTACT, total activity; TOTCORR, total corridor; Vel, velocity.

