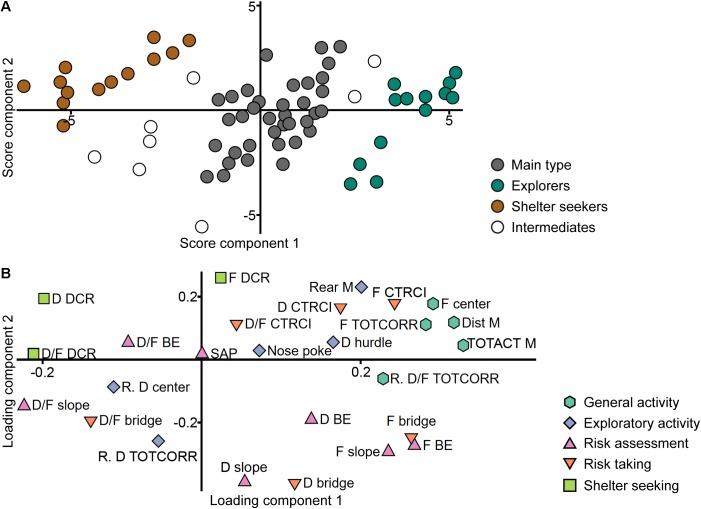
FIGURE 2.
Identification of the behavioral types. Scatter plots of (A) individual scores and (B) variable loadings from the PCA (n = 70, three components, R2X = 0.558, Q2 = 0.333) of the ranked trend analysis parameters in the MCSF test. Score plot colored according to the clusters used to classify the animals into the behavioral types. Loading plot colored according to the functional behavioral categories established in adult animals (Meyerson et al., 2013). BE, bridge entrance; CTRCI, central circle; D, duration; DCR, dark corner room; Dist, distance; F, frequency; M, MCSF; R., ranking reversed; SAP, stretched attend posture; TOTACT, total activity; TOTCORR, total corridor.

