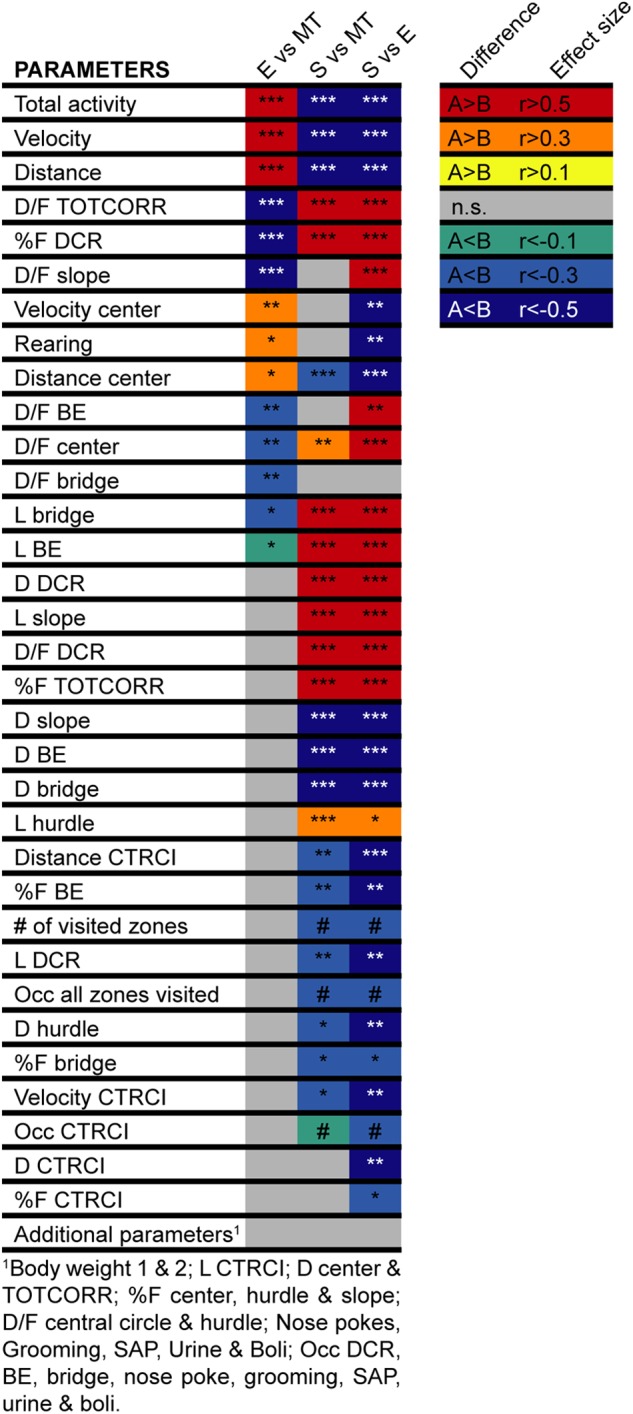
FIGURE 4.

Heatmap of the differences between the behavioral types in the MCSF. Heatmap of the difference in MCSF parameters between rats classified as Explorers (E, n = 13), Shelter seekers (S, n = 13), or Main type (MT, n = 36). The colored squares indicate the direction (red–yellow hues indicate positive effect size, i.e., that the comparing group rank higher, blue–green hues indicate negative effects sizes, i.e., lower ranking) and the level (darker–lighter within each hue category) of the effects size calculated for the significant differences (Fritz et al., 2012). ∗p < 0.05, ∗∗p < 0.01, ∗∗∗p < 0.001, post hoc Mann–Whitney U-test after significant Kruskal–Wallis test; #p < 0.05 Pearson Chi-square test. BE, bridge entrance; CTRCI, central circle; DCR, dark corner room; D, duration; D/F, duration per visit; E, explorer; F, frequency; L, latency; MT, Main type; n.s., non-significant; Occ, occurrence; S, shelter seeker; SAP, stretched attend posture; TOTCORR, total corridor.
