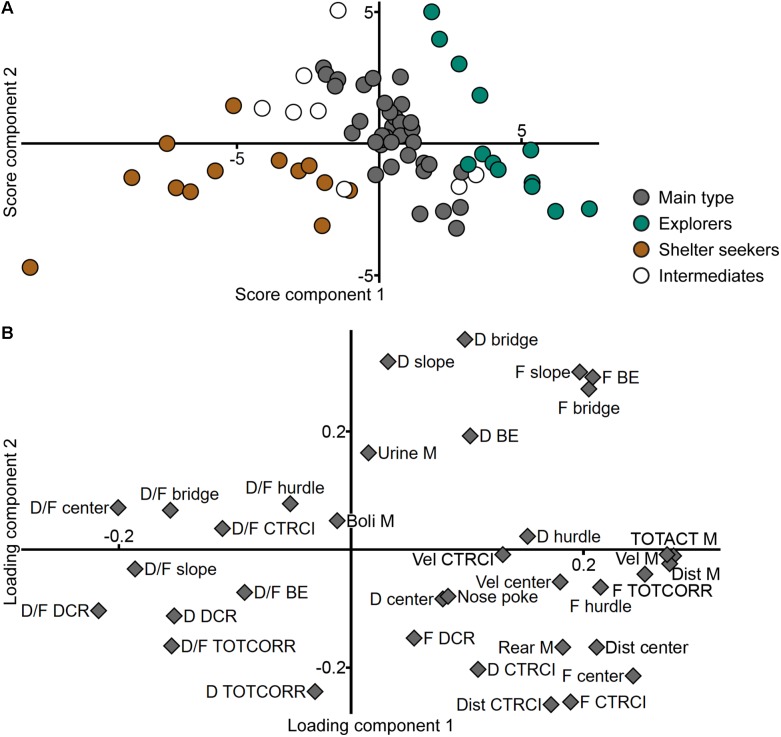
FIGURE 5.
The behavioral types and performance in the MCSF. Scatter plots of (A) individual scores and (B) variable loadings from the PCA (n = 70, four components, R2X = 0.626, Q2 = 0.286) of the MCSF parameters. The score plot is colored according to behavioral type. BE, bridge entrance; CTRCI, central circle; D, duration; DCR, dark corner room; Dist, distance; F, frequency; M, MCSF; TOTACT, total activity; TOTCORR, total corridor; Vel, velocity.

