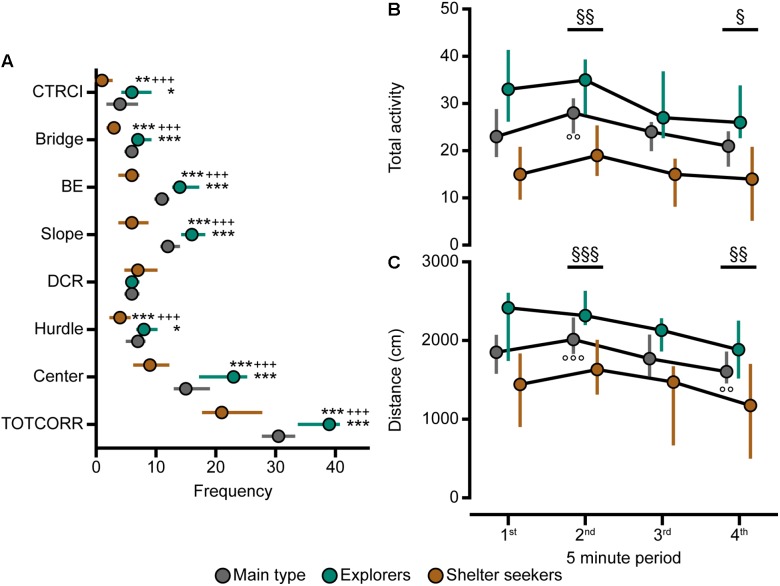
FIGURE 8.
The behavioral types, number of visits to the zones, and activity over time in the MCSF. (A) Frequency of visits to the zones in the whole 20-min trial, (B) total activity and (C) distance traveled during the four 5-min periods of the MCSF test, in Main type (n = 36), Explorers (n = 13), and Shelter seekers (n = 13). Data are presented as median with upper and lower quartiles. ∗p < 0.05, ∗∗p < 0.01, ∗∗∗p < 0.001 relative to Main type; +++p < 0.001 relative to Explorers (Mann–Whitney U-test). §p < 0.05, §§p < 0.01, §§§p < 0.001 for the whole cohort compared to the first 5 min; ∘∘p < 0.01, ∘∘∘p < 0.001 for the Main type compared to the first 5 min (post hoc Wilcoxon matched pairs test). All three behavioral types are significantly different from each other in total activity and distance at all four intra-trial time points (p < 0.05, additional levels of significance not defined; post hoc Mann–Whitney U-test). BE, bridge entrance; CTRCI, central circle; DCR, dark corner room; TOTCORR, total corridor.

