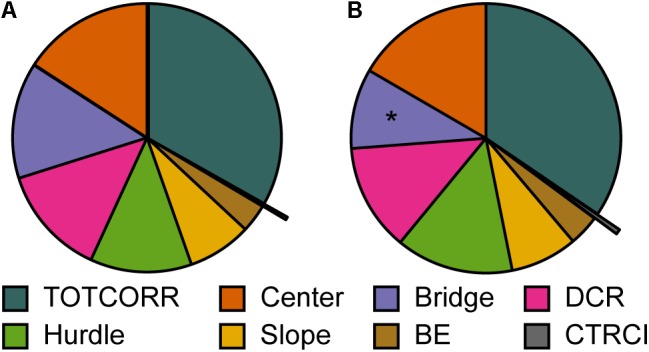
FIGURE 9.

Repeated testing and relative time spent in the zones of the MCSF. Mean percental duration in the zones of the MCSF in (A) trial 1 and (B) trial 2 (n = 12). ∗p > 0.05 relative to trial 1 (Wilcoxon matched pairs test). BE, bridge entrance; CTRCI, central circle; DCR, dark corner room; TOTCORR, total corridor.
