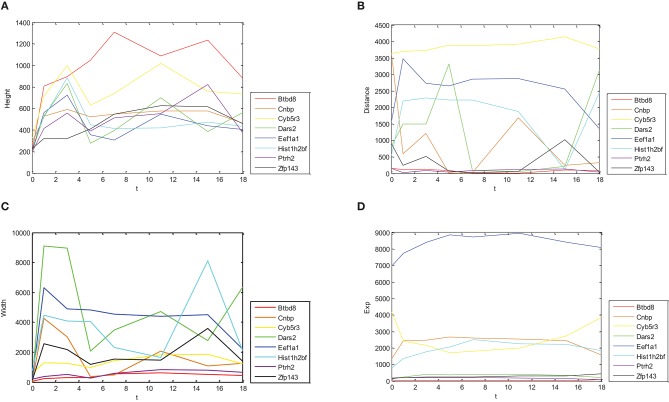
Figure 1.
Dynamic change trends for expressions of different genes and their combination intensity. Dynamic change trends of height, distance, width and expression are shown in (A–D), respectively. X axis represents time with 0, 1, 3, 5, 7, 11, 15, and 18 day(s). Y axis represents corresponding values of eight genes.

