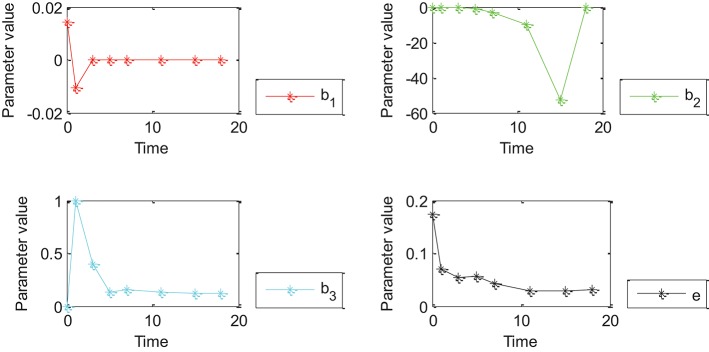
Figure 5.
Effects of Oct4 combination intensity and time on gene expression at different stages of cell development for all genes from GEO. X-axis represents different stages of cell development after 0, 1, 3, 5, 7, 11, 15, and 18 days. Y axis represents parameter value. Curve in red, green, blue, and black represents values of parameter β1, β2, β3 and ε of the proposed generalized linear regression model, respectively.

