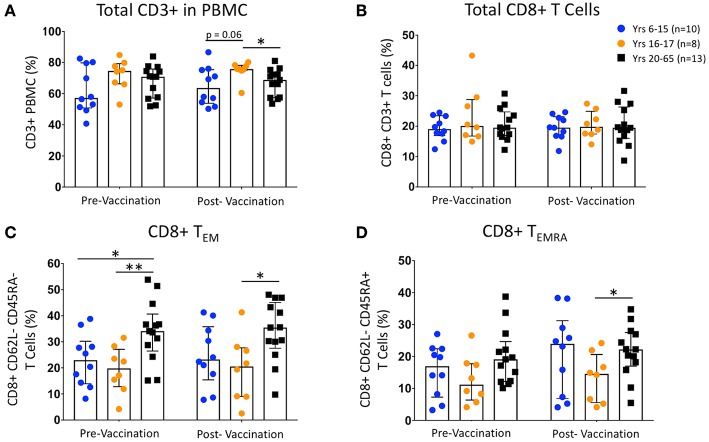
Figure 1.
Change in CD8 T cell Populations Following Ty21a Vaccination. Scatter plots showing the percentages of (A) pre- and post-vaccination CD3+ T cells, (B) total CD8+ T cells, (C) CD8+ T effector memory (TEM; CD45RA- CD62L-), and (D) CD8+ T EMRA (TEMRA; CD45RA+ CD62L-) populations among 6–15 year-old pediatric (n = 10), 16–17 year-old pediatric (n = 8), and adult (n = 13) participants (media). Bars represent medians with whiskers indicating interquartile ranges. Statistics were analyzed by unpaired t-test (*p < 0.05; **p < 0.01).

