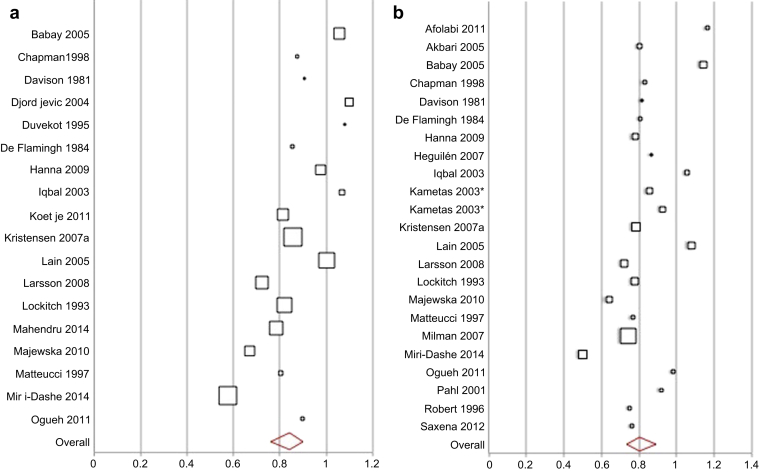
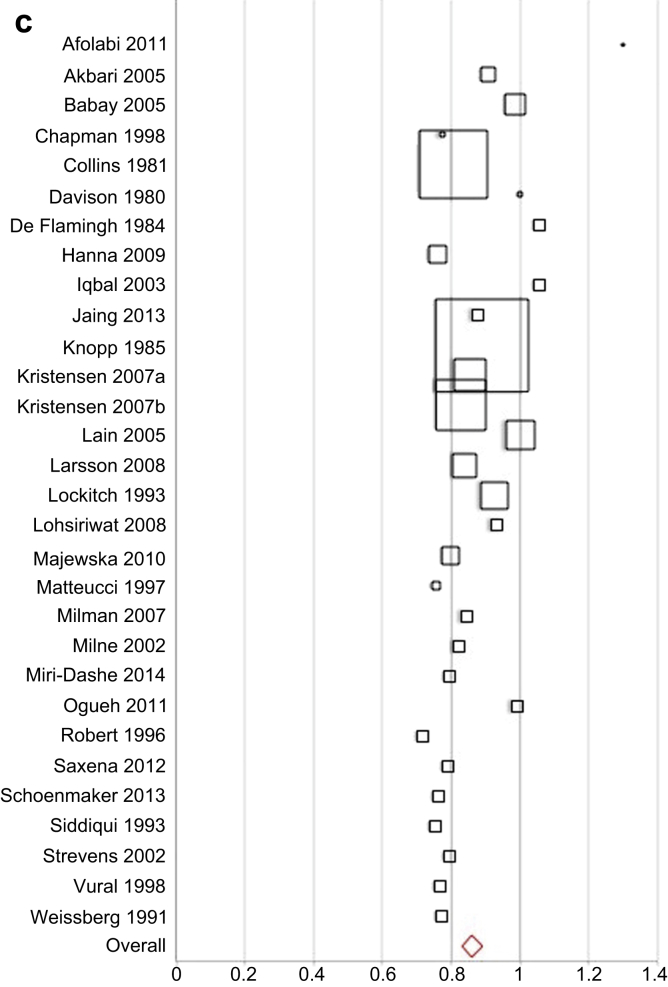
Figure 2.
Pregnant:nonpregnant ratio for the upper limit of serum creatinine in the first trimester (a), the second trimester (b), and the third trimester (c). Squares represent the point estimate of the ratio for each study, sized according to the study weight (geometric mean product of pregnant and nonpregnant sample size). Confidence intervals are not available due to the complexity of determining the precision of a ratio value. Overall is the summary value and 95% confidence interval generated by the bootstrapping technique for each trimester. ∗Two cohorts at different altitudes.


