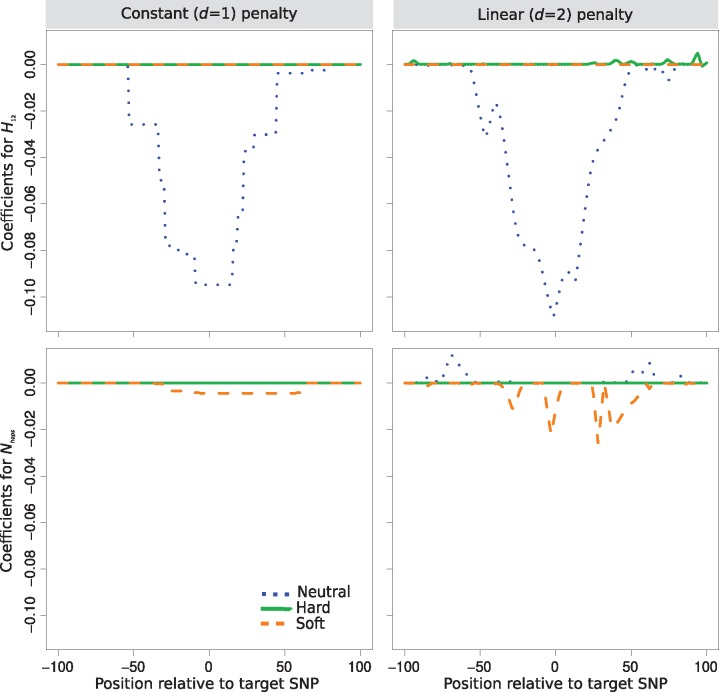
Fig. 4.
Spatial distributions of regression coefficients (βs) in neutral, hard sweep, and soft sweep scenarios for summary statistics H12 and number of distinct haplotypes , for Trendsetter applied with constant (d = 1) and linear (d = 2) trend penalties. Trendsetter was trained on simulations with selection strength sampled uniformly at random on a log scale. Note that the distributions of regression coefficients for both summary statistics are plotted on the same scale, thereby making the distribution of difficult to decipher as its magnitude is small relative to H12.

