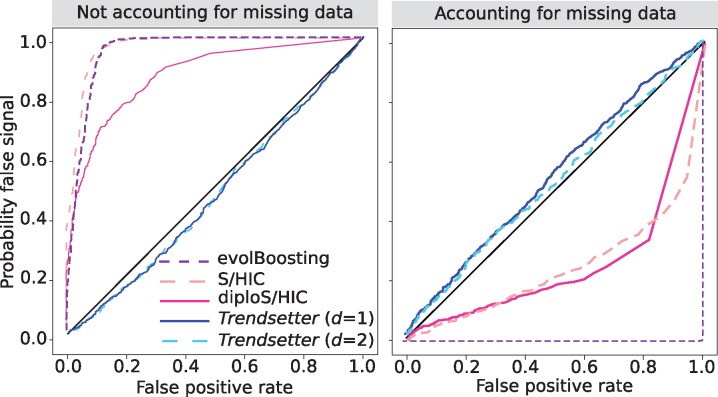
Fig. 6.
Probability of misclassifying neutral regions with extensive missing data as a sweep for various methods, under a constant-size demographic history. Each panel compares the combined probability of any sweep (hard or soft) under simulations with missing data (probability of false signal) to the same probability under neutral simulations (false positive rate) for scenarios in which missing data are (right) or are not (left) accounted for when training a classifier to compute the probability of a false signal. All methods were trained with three classes: neutral, hard sweep, and soft sweep.

