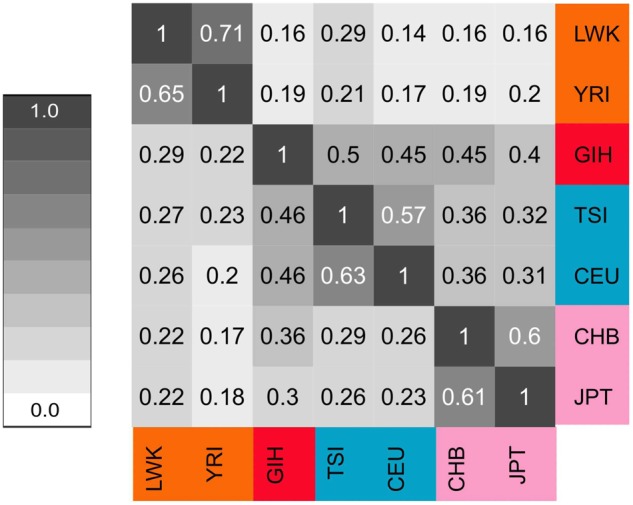
Fig. 8.

Heatmap representing the sharing of soft sweep classifications across worldwide human populations. The cell at row j and column k represents the proportion of nonoverlapping 10-kb genomic segments classified as a soft sweep in the population at row j that are also classified as a soft sweep in the population at column k. By definition, this heatmap is asymmetric.
