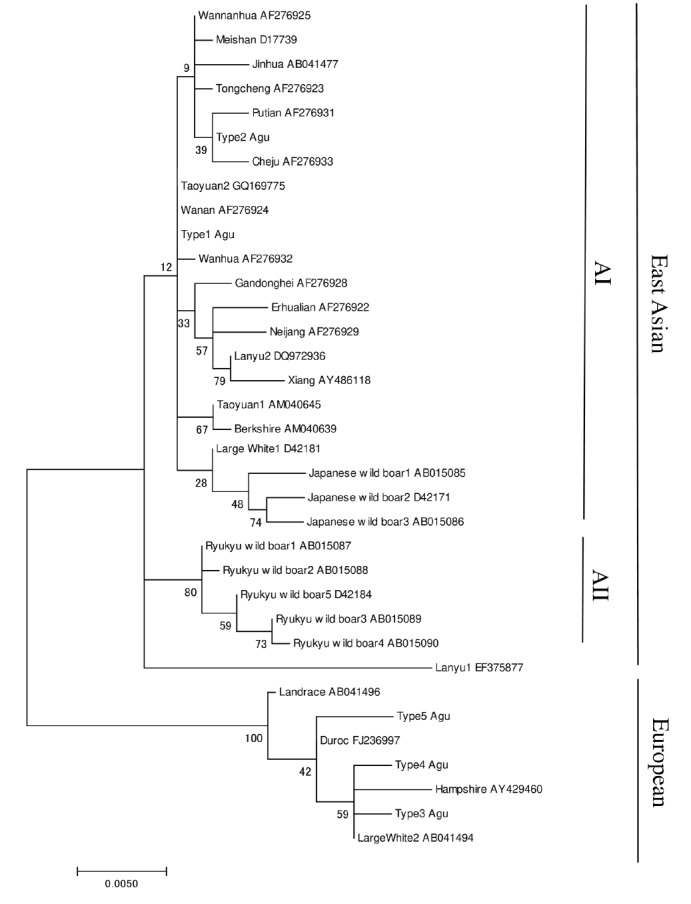
Figure 2.

Maximum likelihood phylogenetic tree among the 35 pigs mtDNA control region haplotypes. The phylogenetic tree was inferred by the Hasegawa-Kishino-Yano model with invariable positions and Gamma distribution. Numbers on the branches show bootstrap values based on 1,000 bootstrap replicates.
