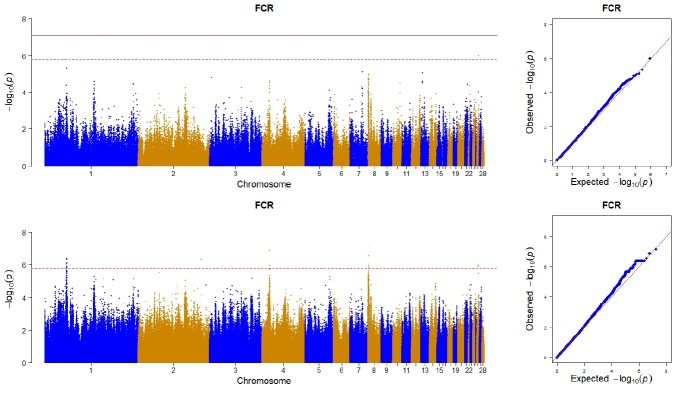
Figure 1.
Manhattan plot (left) and quantile-quantile plot (right) of the observed p-values for feed conversion ratio (FCR) using chip data (top) and imputed whole sequence data (bottom). In the Manhattan plots, the position of each single nucleotide polymorphism on the chromosome was plotted against its −log10- transformed p-value. The dotted red line and solid red line in the Manhattan plots represent the significant threshold of 1.58×10⁻⁶ and 7.92×10⁻⁸ respectively. For quantile-quantile plot, the x-axis represents the expected −log10-transformed p-values, and the y-axis represents the observed −log10-transformed p-values.

