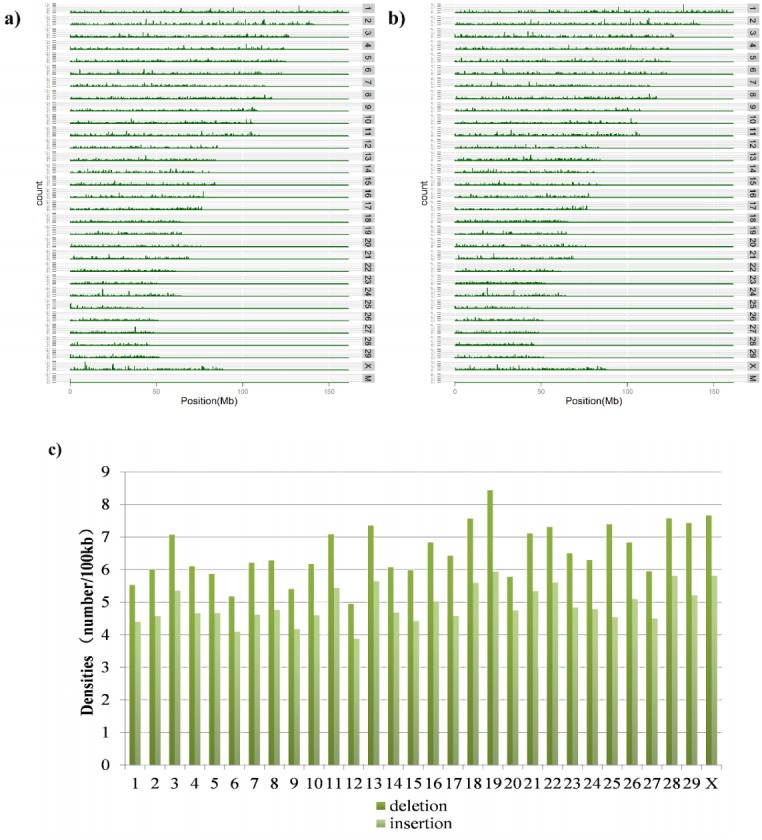
Figure 1.

Distribution of the density of deletions and insertions across chromosomes. (a) Shows the location distribution of deletions across the genome; (b) represents the location distribution of insertions across the genome; and (c) demonstrates the distribution of the density of deletions and insertions across chromosomes calculated as the number of structure variations per 100 kb.
